Teaching and learning
Accreditation period Units 3 and 4: 2023-2026
The VCE Algorithmics (HESS) Study Design 2023–2026 support material provides teaching and learning advice for Units 3 and 4 and assessment advice for school-based assessment in Units 3 and 4.
The program developed and delivered to students must be in accordance with the VCE Algorithmics (HESS) Study Design 2023–2026
Unit 3: Algorithmic problem-solving
Unit 3 Area of Study 1: Data modelling with abstract data types
Outcome 1
On completion of this unit the student should be able to define and explain the representation of information using abstract data types, and devise formal representations for modelling various kinds of real-world information problems using appropriate abstract data types.
Examples of learning activities
- Compare the input and output data for a curated selection of problems and identify similarity in the structural features of the data, such as basic data types, ordering, uniqueness or inter-relationships between the data.
- Students are guided through the process of writing signature specifications for known processes. Processes could be described in a range of ways, such as in pseudocode, plain language, flow charts or through an IPO chart.
- Explore conventions in algorithms written in pseudocode and coding languages for representing ADTs and the typical operations, expected inputs and expected outputs. Activities can include execution trace of existing or created algorithms that use these ADTs, in particular graph traversal algorithms within the study.
- Explore simple ADTs (variable, array, list, stack, queue) as a way of holding the information for a problem that is being solved by an algorithm; explore planning problems as the motivation for using graphs.
- Create a glossary of key graph vocabulary with written definitions and accompanying diagrams.
- Consider problems where sequence, proximity or relationships are important information elements for solving a problem and how graph ADTs can be used for representation of information.
- Explore a range of real-world problems that can be modelled using graphs, and identify how the features of these problems lead to them being appropriately modelled by particular categories of graph.
- Take a larger problem and apply a top-down design approach, identifying the signatures of functions that will be required to solve the larger problem
- Solve planning problems, such as ‘river crossing’ or puzzle problems suited to being solved with state graphs, and develop skills for describing how the features of the problem map to features of the data structures.
Detailed example
River crossing planning problem
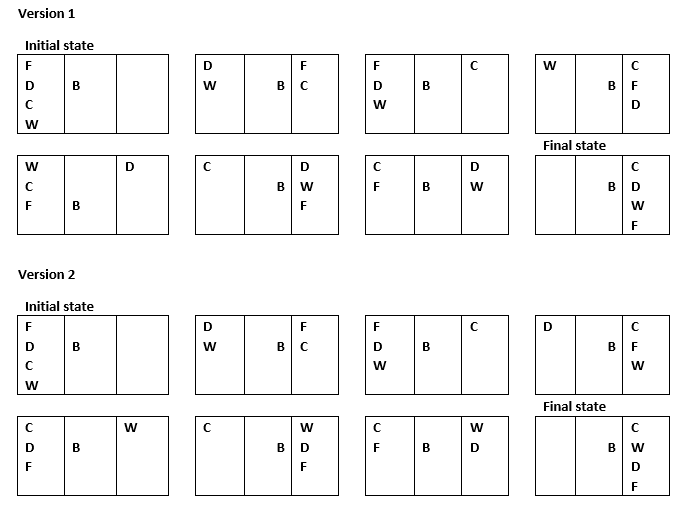
A farmer, a dog, a chicken and a bag of wheat need to cross a wide river. They have access to a rowboat. All must cross on the boat. The farmer can only take a maximum of one item with him on each boat trip. He cannot leave the dog and chicken unattended together as the dog will eat the chicken. He cannot leave the chicken and wheat together unattended as the chicken will eat the wheat. How can this menagerie cross the river safely?
- Give a written description in English of how this can be done by the farmer.
- Give a pictorial representation to show all the possible ways of getting from the ‘Initial state’ of this problem to the ‘Final state’ of this problem.
- Recreate your stages in part B using any abstract data types for representing the farmer, dog, chicken, wheat and boat, indicating whether they / it is on the left or right of the river.
- Justify and explain why you have chosen each ADT to represent the solution to this problem.
- Solve planning problems, such as ‘river crossing’ or puzzle problems suited to being solved with state graphs, and develop skills for describing how the features of the problem map to features of the data structures.
Sample partial solution
Part A solution
Firstly, the farmer must take the chicken with him across the river. The farmer can then come back to collect either the dog or the wheat, take it across the river and then cross back to collect the remaining item with the chicken in the boat. The farmer is to leave the chicken and cross the river with the dog/wheat. Finally, the farmer can come back alone to bring the chicken across the river.
Unit 3 Area of Study 2: Algorithm design
Outcome 2
On completion of this unit the student should be able to define and explain algorithmic design principles, design algorithms to solve information problems using basic algorithm design patterns, and implement the algorithms.
Examples of learning activities
- Develop understanding of the key concepts of sequence, branching and looping through appropriately selected worked examples.
- Create simple algorithms in class activities using conditional, iterative and defined function structures to control action execution, incorporating variables and ADTs, including algorithms that require the combination of multiple conditions using logical operations.
- Implement simple algorithms from pseudocode using either a visual or block-based programming environment, such as Edgy, or a general-purpose or text-based programming language, such as Python.
- Identify self-similar relationships in familiar examples, such as factorials, Fibonacci numbers or fractal curves, to develop their understanding of recursive definitions.
- Create your own written and coded algorithms using recursion and / or iteration for simple information problems.
- Solve puzzles using iteration and simple decrease and conquer recursion. Examples could include cryptarithmetic puzzles and anagrams.
- Examine information problems where greedy methods can be used to create correct algorithms. Contrast these with problems that cannot be solved with greedy methods.
- Apply graph traversal techniques to develop algorithms to test for graph properties, such as connectivity and cyclicity.
- Create a poster that explains the operation of one of the specified graph algorithms (with a worked example) and describes a logical argument for the correctness of the algorithm.
- Identify the structural elements of the induction or contradiction methods within an explanation for the correction of an algorithm.
Detailed example
Algorithm challenge – Eating jellybeans
Mary likes to eat jellybeans. Her methods are rather idiosyncratic and follow the rules:
- Eats exactly one jellybean at a time.
- Eats a jellybean from a colour that has the most number of jellybeans left.
- If there is a tie on colours, selects by preference.
- Mary prefers red jellybeans the most, then green, and then blue.
For example if there are 3 red, 4 green, and 2 blue, which could be represented using two lists:
- ColourPreference={red,green,blue}
- ColourQuantity={3,4,2}
Then Mary will eat the jellybeans in the following order: green, red, green, red, green, blue, red, green, blue.
Write an algorithm to facilitate Mary’s jellybean eating methods. You will input a list in order of Mary’s preference of 1 to N distinct colours of jellybeans and a second list which contains the corresponding number of jellybeans of each colour.
- ColourPreference={red,green,blue,pink,yellow}
- ColourQuantity={3,3,4,2,7}
Sample partial solution as an algorithm as it would appear in Edgy using conditionals, iteration and defined functions
The pseudocode shows the blocks which define a function called MaryEatsJBs.
Function MaryEatsJBs
SetupDictionary()
SetupPQueue()
Repeat until (is empty(MPriority))
Set variable colour to head(MPriority)
Enqueue colour to EatingOrderQ
If MDictionary[colour] > 1 do
Set MPriority[head(MPriority)] to EatThisColour(head(MPriority))
Else
Dequeue(MPriority)
Unit 3 Area of Study 3: Applied algorithms
Outcome 3
On completion of this unit the student should be able to design suitable solutions for real-world problems that require the integration of algorithms and data types, including the communication of solutions and their justification.
Examples of learning activities
- Review the characteristics of ADTs and their applicability to different algorithm design patterns; for example, the use of the priority queue for greedy algorithms, and consider their applicability for solving particular problems.
- Complete a compare-and-contrast for the application of two data structures for storing the information in a problem, with a focus on the use of evidence from the problem to justify conclusions.
- In small groups, create data model specifications and write algorithms in structured pseudocode to solve complex problems.
- Peer-review other students’ data model and algorithm designs and provide feedback on the designs.
Detailed example
Developmental project – Analysing character relationships in text
Students create a data model to store information about relationships between characters in a text they are studying or have studied, and then create algorithms to analyse these relationships. This could be done in small groups and could be broken up into stages.
These are examples of prompts that could be used when students are creating a data model for the character relationships.
- Which characters are used to develop the theme? What role do they play in the unfolding action?
- What kinds of relationships exist between the characters? How many interactions exist between the characters in the story?
- What are the main events? Which characters are involved?
- Create a data model representing your characters and their characteristics. You can use Edgy to prototype your ideas.
- Model the relationships between characters (such as kinship, friendship, culture, shared traits / geography, number of conversations) and may include other factors (themes, settings) that may be particular to your story.
Students could be given an opportunity to peer-review each other’s data models.
These are examples of prompts that could be used when students are creating algorithms to analyse the character relationships.
- How could the graph algorithms you have studied be used to analyse relationships between characters in this text? You could consider grouping characters by certain characteristics or shared properties involving themes, traits and actions.
- Write an algorithm that determines who the central characters are in your text.
- Write an algorithm that ranks the characters in the text according to their importance. You could consider their proximity to other characters or to the themes or events in the text.
These are examples of prompts that could be used when students are justifying their proposed solutions.
- Discuss why you selected particular data models and algorithms for your design.
- What other designs might have also met the requirements?
- Provide a logical argument for the correctness of your solution for identifying shared properties and establishing importance and proximity of characters.
- Provide a conclusion, which is a reflection on how your model could be improved by comparing different models and algorithms that could have been used. Describe with the benefit of hindsight what you would have done differently if you could do this project again?
Sample text analysis – Macbeth
The pseudocode below identifies characters and action in an Act in Macbeth.
Algorithm EnquireAct(input Act)
// identify characters & action in Act of Macbeth
if (Act exists as a graph node) then
set Act.node.colour to red
if (dictionary of characters contains key=Act) then
for each character in Act do
set character.node.colour to red
if (dictionary of actions contains key=Act) then
report the action
else
report undefined Act in Macbeth
The pseudocode shows the blocks which define a function called EnquireAct which has a single argument called Act.
Function EnquireAct
If (Act is a node in the graph) do
Set colour of node Act to red.
If the dictionary Acts-Characters contains Act do
Say Acts-Characters[Act] for 2 seconds.
For each item in Acts-Characters[Act] do
If (item is a node in the graph) do
If the dictionary Acts-Action contains Act do
Set the variable action to Acts-Action[Act].
Else
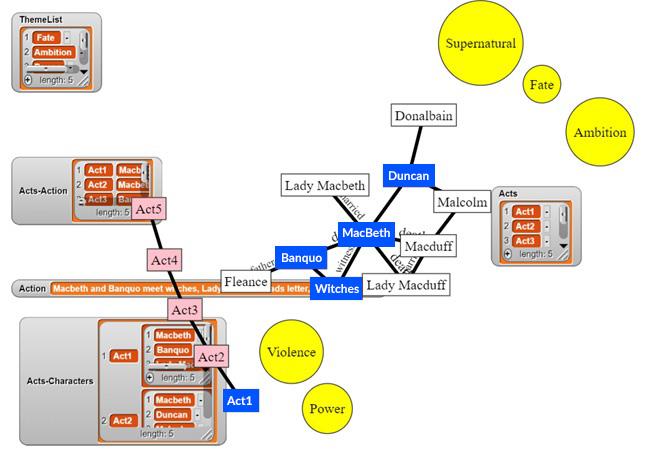
Figure 2
Unit 4: Principles of algorithmics
Unit 4 Area of Study 1: Formal algorithm analysis
Outcome 1
On completion of this unit the student should be able to establish the efficiency of simple algorithms and explain soft limits of computability.
Examples of learning activities
- Examine how different algorithms for a problem, such as calculating the n’th triangular number, vary in how many operations they perform for different inputs.
- Step through the execution of simple iterative or nested iterative algorithms with inputs of increasing size and record the number of operations required in a table. Identify simple polynomial patterns in the number of operations required as a function of the size of the input.
- Given a selection of example functions, analyse how simple mathematical functions can describe upper bounds for these examples.
- Examine selected case studies of maliciously designed inputs that lead to algorithms exhibiting worst-case running time.
- Create recurrence relations that describe the running time of algorithms as a function of their input size for a range of example decrease-by-constant and decrease-by-factor recursive algorithms given in pseudocode.
- In small groups, investigate methods for solving recurrence relations, such as analysing call trees or repeated substitution, to identify the conditions that give rise to the different cases of the Master Theorem.
- Create a poster that summarises each of the common time complexity results, and provides examples of algorithms with each complexity and a description of how common features of these algorithms give rise to the relevant time complexity.
- Create a Venn diagram that shows the relationships between different problem classes.
- Execute a super-polynomial time algorithm for increasingly larger inputs until the algorithm takes too long to run.
- In small groups, discuss a real-world case study, such as warehouse logistics or automated mathematical proofs, to determine how the real-world requirements impact on the feasibility of finding a suitable solution; for example, practical input sizes, the structure of real-world inputs, and the quality requirements for the solution
Detailed example
Investigating methods for solving recurrence relations
Students are required to be able to fluently solve recurrence relations by applying the Master Theorem. One way in which students could be supported to develop a deep understanding of the Master Theorem is by exploring how the three different cases in the Master Theorem arise. This can also assist students to improve their understanding of recurrence relations in general.
Consider a divide and conquer algorithm for finding the lowest item in a list of length n. It divides the list into two halves, finds the minimum of each half and then calculates the global minimum. The recurrence relation for this algorithm is shown below.
$\large {T(1) = 1T(n) = 2T\left(\frac{n}{2} \right) + 1}$
Consider also the mergesort algorithm. Its recurrence relation is shown below.
$\large {T(1) = 1T(n) = 2T\left(\frac{n}{2} \right) + k \cdot n}$
A third recurrence relation could also be considered.
$\large {T(1) = 1T(n) = 2T\left(\frac{n}{2} \right) + k \cdot n^2}$
The time complexity of algorithms with these algorithms can be investigated in a range of ways. One method is to draw their call tree and observe the running time in each call of the algorithm. For example:
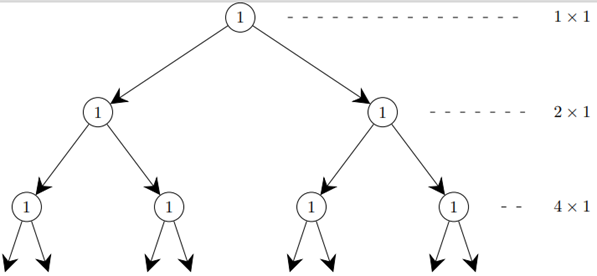
Figure 3
It can be seen that for the first recurrence relation, the sum of each level of the call tree increases as the execution goes deeper into the call tree. It can also be observed that each level of the call tree is more than the sum of all previous levels. It can be concluded that for this type of algorithm, most of the work is being done in the leaves of the call tree.
The depth of the call tree is (n).
The sum of the rows is $\large {1 + 2 + 4 + \dots \underbrace(n)terms = 2^{(n)} -1 = n-1 }$
A question that could lead students in their investigation is:
Under what conditions is most of the work done in the leaves of the call tree? When is most of the work done in the root of the tree? When is the work spread evenly at each depth of the tree?
Another method that students can use to analyse recurrence relations is repeated substitution. To do this, the recurrence relation is repeatedly substituted into itself until a recognisable pattern is noticed. For example:
$\large {T(n) =2T\left(\frac{n}{2}\right) + 1 = 2\left(2T\left(\frac{n}{4}\right)+1 \right) = 4T\left(\frac{n}{4}\right)+2 +1 = 4\left(2T\left(\frac{n}{8}\right)+1 \right) +2 +1}$ $\large{=8T\left(\frac{n}{8} \right)+4+2+1=8\left(2T\left(\frac{n}{16}\right)+1\right)+4+2+1 =16T\left(\frac{n}{16} \right)+8+4+2+1 = \dots}$
At this point, the pattern 1 + 2 + 4 + 8 + … might be observed. Students who have studied sequences and series in mathematics will be able to apply those skills here.
Unit 4 Area of Study 2: Advanced algorithm design
Outcome 2
On completion of this unit the student should be able to solve a variety of information problems using algorithm design patterns and explain how heuristics can address the intractability of problems.
Examples of learning activities
- Play the 'Guess the number in my head' game. Discuss the optimal strategy for quickly finding the secret number, and identify how this corresponds to the binary search algorithm.
- Simulate by hand, using physical objects of different size or weight, or act out in person, the execution of the mergesort and quicksort algorithms.
- Implement the algorithm for the change-making problem using a block-based or text-based programming language.
- Draw the search tree explored by a backtracking algorithm for the knapsack problem with a small bag of items.
- Complete a compare-and-contrast of the merits and limitations of using exact methods and heuristic methods for specific case studies. Case studies could be chosen to vary based on whether the solution will be used once or repeatedly, or in the timeframe within which the solution is required.
- Implement a hill-climbing heuristic algorithm for the graph-colouring problem and then adapt this to use the simulated annealing meta-heuristic.
- Prepare an oral presentation that explains how heuristics can be applied to one of the graph-colouring, 0–1 knapsack or travelling salesman problems
Detailed example
Acting out the mergesort and quicksort algorithms
Required materials:
Either one set for a class demonstration or several sets for students to do the activity in groups following the teacher’s demonstration.
- A selection of 8–12 objects that can be ordered in some way, such as containers of different sizes or weights, or playing cards.
- If varying containers by weight, it is preferable to use a mechanical balance. Alternatively, students can compare weights by hand.
Activity
- Demonstrate the process of sorting the objects using the mergesort algorithm. At each step, students draw a diagram of the objects. After the demonstration, they try to describe the process in pseudocode.
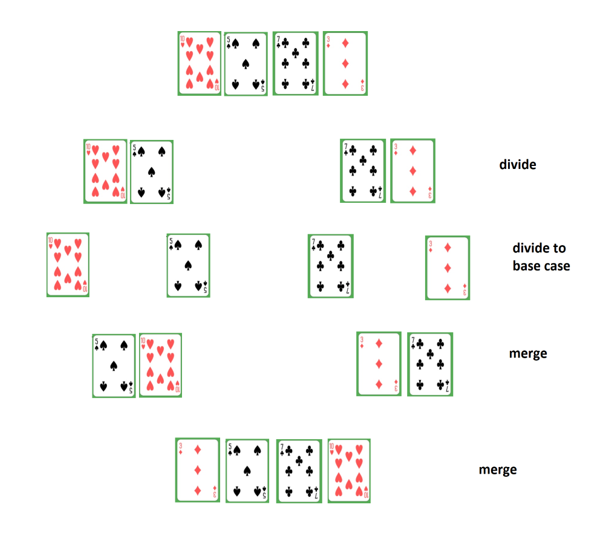
Figure 4: An example diagram
(Original image created using card images from a public domain source
English_pattern_playing_cards_deck.svg)
Repeat this for the quicksort algorithm.
In small groups, students compare and contrast the divide and merge steps of the two algorithms. Prompts could include:
- What is similar and what is different about how the two algorithms divide the input list?
- What is similar and what is different about how the two algorithms merge the results of the recursive calls?
Unit 4 Area of Study 3: Computer science: past and present
Outcome 3
On completion of this unit the student should be able to explain the historical context for the emergence of computer science as a field and discuss modern machine learning techniques and the philosophical issues they raise.
Examples of learning activities
- Research issues that were part of the foundational crisis of mathematics in the early 20th century, such as Russell's paradox, and create a timeline of events.
- Step through the execution of a small two- or three-state Turing machine.
- Create a diagram that explains the relationships between decidable and undecidable problems and tractable and intractable problems.
- Consider how several example problems, such as automated program verification, can be reduced to the Halting Problem and draw conclusions about what limits this implies for application of computers for solving problems.
- Create a mind map that illustrates the relationships between different philosophical conceptions of artificial intelligence.
- Hold a class debate about the merits of the Chinese Room Argument.
- Create a flowchart that describes in abstract how data-driven algorithms are created.
- Compare the results of fitting linear, quadratic and quartic polynomial models to data with an underlying quadratic structure.
- Hold a class discussion on how statistical outliers affect prediction models, and the consequences of bias in datasets through the use of selected case studies.
- Estimate the line of the margin-maximising linear classifier by hand using a ruler for two-dimensional data.
- Apply a x →(x, x2) transformation to data using graph paper and draw a linear separator for points in the centre of the data set.
- Explore the structure of a multi-layer perceptron and how to fit non-linear data patterns using an online neural network simulator.
- Read media articles (e.g. from newspapers or popular science magazines) on current ethical issues relating to the application of artificial intelligence, and create an informative presentation
Support vector machines (SVM) as margin-maximising linear classifiers, including:
- the geometric interpretation of applying SVM binary classification to one- or two-dimensional data
- the creation of a second feature from one-dimensional data to allow linear classification.
Detailed example
Visually explore margin-maximising linear classifiers
Required materials:
The key knowledge states that students are required to understand the geometric interpretation of applying SVM binary classification to one- or two-dimensional data. Student learning activities for this topic should focus on graphical analysis of one- and two-dimensional data.
For example, a network engineer needs to detect whether a user is a person or a robot. They record the number of requests made by some known users, some of which were people and some of which were robots. These are plotted below.
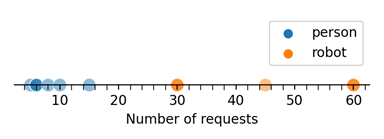
Figure 5
Students use a ruler to identify where the margin-maximising linear classifier would be for this data and illustrate it onto the chart. They also label the margin and estimate its size.
They should encounter data sets that cannot be separated by a linear classifier. For example, a road traffic engineer is trying to automate the detection of abnormal traffic conditions on a highway. They collect the following records of traffic volume during peak hour.
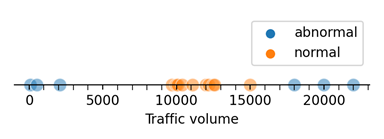
Figure 6
Visual tools can also be used to develop an understanding of how new features can be created from existing features in data. For example, if the traffic volume data is squared and this is a new dimension, then the two sets can be linearly separated.
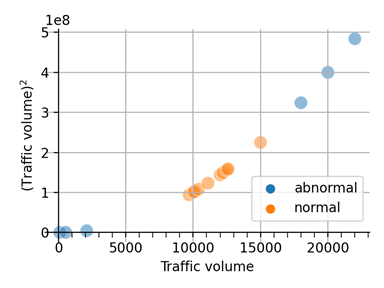
Figure 7