Units 3 and 4: Data Analytics - School-assessed Task
When designing learning activities for the School-assessed Task, teachers will refer to the problem-solving methodology specifications, and the areas of study and outcomes, including key knowledge and key skills, as listed in the VCE Applied Computing Study Design.
The following table gives a breakdown of the four stages of the problem-solving methodology for the School-assessed Task.
| Unit 3 Outcome 2 | Unit 4 Outcome 1 |
|---|
|
Analysis |
Design |
Development |
Evaluation |
Project management - Develop a project plan (Gantt chart)
- Create, monitor and modify the project plan
|
Project management - Monitor, modify and annotate the project plan
- Assess the effectiveness of the project plan
|
Analysis - Propose a research question
- Collect and analyse data
- Document solution requirements, constraints and scope
|
Design - Generate alternative design ideas
- Develop evaluation criteria
- Develop detailed design
|
Development - Manage files
- Develop infographics and dynamic data visualisations
- Validate, test and modify
|
Evaluation - Evaluate the efficiency and effectiveness of the infographics or dynamic data visualisations
|
Focus of the SAT
The Data Analytics School-assessed Task is in two parts involving Unit 3 Outcome 2 and Unit 4 Outcome 1.
Throughout the School-assessed Task students will develop their critical and creative thinking, communication, personal and ICT skills.
The School-assessed Task contributes 30 per cent to the study score for Data Analytics. Details of the assessment task can be found on page 34 of the
 VCE Applied Computing Study Design (docx - 357.7kb).
Teachers must be aware of the current VCE Computing: Data Analytics administrative information for school-based assessment. This document contains assessment information on the nature and scope of the task, mandated assessment rubrics and authentication information, including forms and School-based Assessment Task assessment sheets for scores. Teachers are reminded of the need to comply with the authentication requirements specified in the Assessment: School-based Assessment section of the current
VCE and VCAL Administrative Handbook. This is important to ensure that undue assistance is not provided to students undertaking assessment tasks.
Teachers must plan and use observations of student work in order to monitor and record each student’s progress as part of the authentication process. A record of these details are to be included on the Authentication Record Form in the
VCE Computing: Data Analytics: Administrative information for School-based Assessment.
The VCAA conducts professional learning for teachers of Data Analytics in February of each year through face-to-face sessions and webinars. These are known as SAT Training Days and SAT Webinars. Details of these professional learning sessions are advertised in the November edition of the
VCAA Bulletin each year.
School-assessed Task – Part 1
Unit 3: Area of Study 2 – Data analytics: analysis and design
The first part of the SAT requires students to propose a research question that will be developed into infographics or dynamic data visualisations in order to present their findings. Teachers should discuss with students their ideas to ensure that the infographics or dynamic data visualisations can be feasibly completed within the timeframe available. It is also necessary for students to document their thinking to ensure that both they and their teacher understand the tasks they are expected to complete and the methods and techniques they will use to achieve them. For example, students could provide a statement of intent about their research question and the overall project. Teachers should not provide individual students or classes with research questions; students must generate their research question themselves.
Project Management
Students will produce a project plan (Gantt chart) that outlines the tasks, sequencing, time allocation, dependencies, milestones and the critical path. They will follow the project plan to develop their infographics or dynamic data visualisations for their research question. The project plan takes into consideration all stages and activities of the problem-solving methodology covered in Unit 3 Outcome 2 and Unit 4 Outcome 1. Once the project plan has been developed it will be monitored and modified throughout the entire project. Students do not have to use dedicated project-management software in the development of their project plan.
Below is a sample project plan.
Analysis stage
The analysis stage of the problem-solving methodology requires students to propose a research question and to collect and analyse data. Students are required to collect data that will inform the analysis of their research question. Data collection should include a range of methods and techniques, including interviews, observation, querying of data stored in large repositories and surveys.
Teachers should encourage students to adopt the best possible approach when creating their research question. The question should be researchable within the timeframe available and allow for an analytical response rather than a descriptive one. A helpful guide is provided on the
Monash University website.
Students document their analysis to clearly outline the use of data to support the research question for the proposed infographics or dynamic data visualisations. They should include a statement of functional and non-functional requirements, constraints and scope.
The example below is a sample process for developing a research question with the supporting documentation.
Example
Research question: Should the Australian Government promote a greater reliance on renewable energy in order to reduce Australia’s contribution to climate change?
Functional requirements
- Data requirements
- Primary data – surveys and interviews with peers, focus groups or expert
- Secondary data – data from large repositories
- Infographic/dynamic data visualisation requirements
- Data is simplified and presented as information using graphics
- Users can interact with dynamic data visualisations
- Users can view data changing over time
Non-functional requirements
- Ability for viewer to understand the message being conveyed
- Accessibility
- Use of different devices/screen sizes/operating systems
- Understanding the needs of visually impaired people and incorporating some text/audio findings, as well as using colours that do not regularly impact those with colour-blindness
Constraints
- Economic
- Time constraints: due dates
- Technical
- Availability of equipment: labs, laptops, Wi-Fi
- Security – use of cloud and network infrastructure
- Social
- Level of expertise of users: need for intuitive interface for dynamic data visualisations
- Legal
- Protecting privacy of those providing data: primary sources
- Ownership of data: referencing secondary sources using the APA method
- Usability
- Ease of use of solution: link with social constraint about intuitive interface
- Usefulness: ensure that all features of making a data visualisation interactive improves the user’s experience
Scope
- Included in this solution:
- Timeframe (from 2000 to 2020 – and beyond using forecasts)
- Countries (Australia and a number of relevant comparisons – USA, India, Canada, China)
- Technology (restricted to currently implemented power usage technologies such as coal, gas, coal seam gas (CSG), photovoltaic solar, thermal)
- Impact of global agreements on CO2 emissions (Kyoto, Paris)
References
Design stage
The design stage of the problem-solving methodology requires students to develop evaluation criteria, generate alternative designs and develop and justify preferred designs.
Students demonstrate evidence of their design ideas through the generation of two or three alternative design ideas for their proposed infographics or dynamic data visualisations. These design ideas should be broad in nature and consider the appearance of the infographics or the appearance and functionality of the dynamic data visualisations. Examples of design ideas may include layout diagrams, data dictionaries, storyboards and annotated mock-ups. Students consider the design principles that influence the design of the infographic or dynamic data visualisations.
Students are required to develop evaluation criteria that will be used to evaluate their design ideas and in Unit 4 Outcome 1, their proposed infographics or dynamic data visualisations. Evaluation criteria for design ideas can include the appearance of the proposed infographics and the appearance and functionality of proposed dynamic data visualisations. The evaluation criteria should reference the functional and non-functional requirements in the analysis and the effectiveness of the proposed infographics or dynamic data visualisations.
The evaluation criteria are used to determine and justify which of the design ideas should be further developed into detailed designs. The detailed designs should be representative of how the proposed infographics or dynamic data visualisations will appear or function. The same design tools as used above could be used within the detailed design, complete with annotations, explanations and justifications.
Below is a process for developing detailed designs.
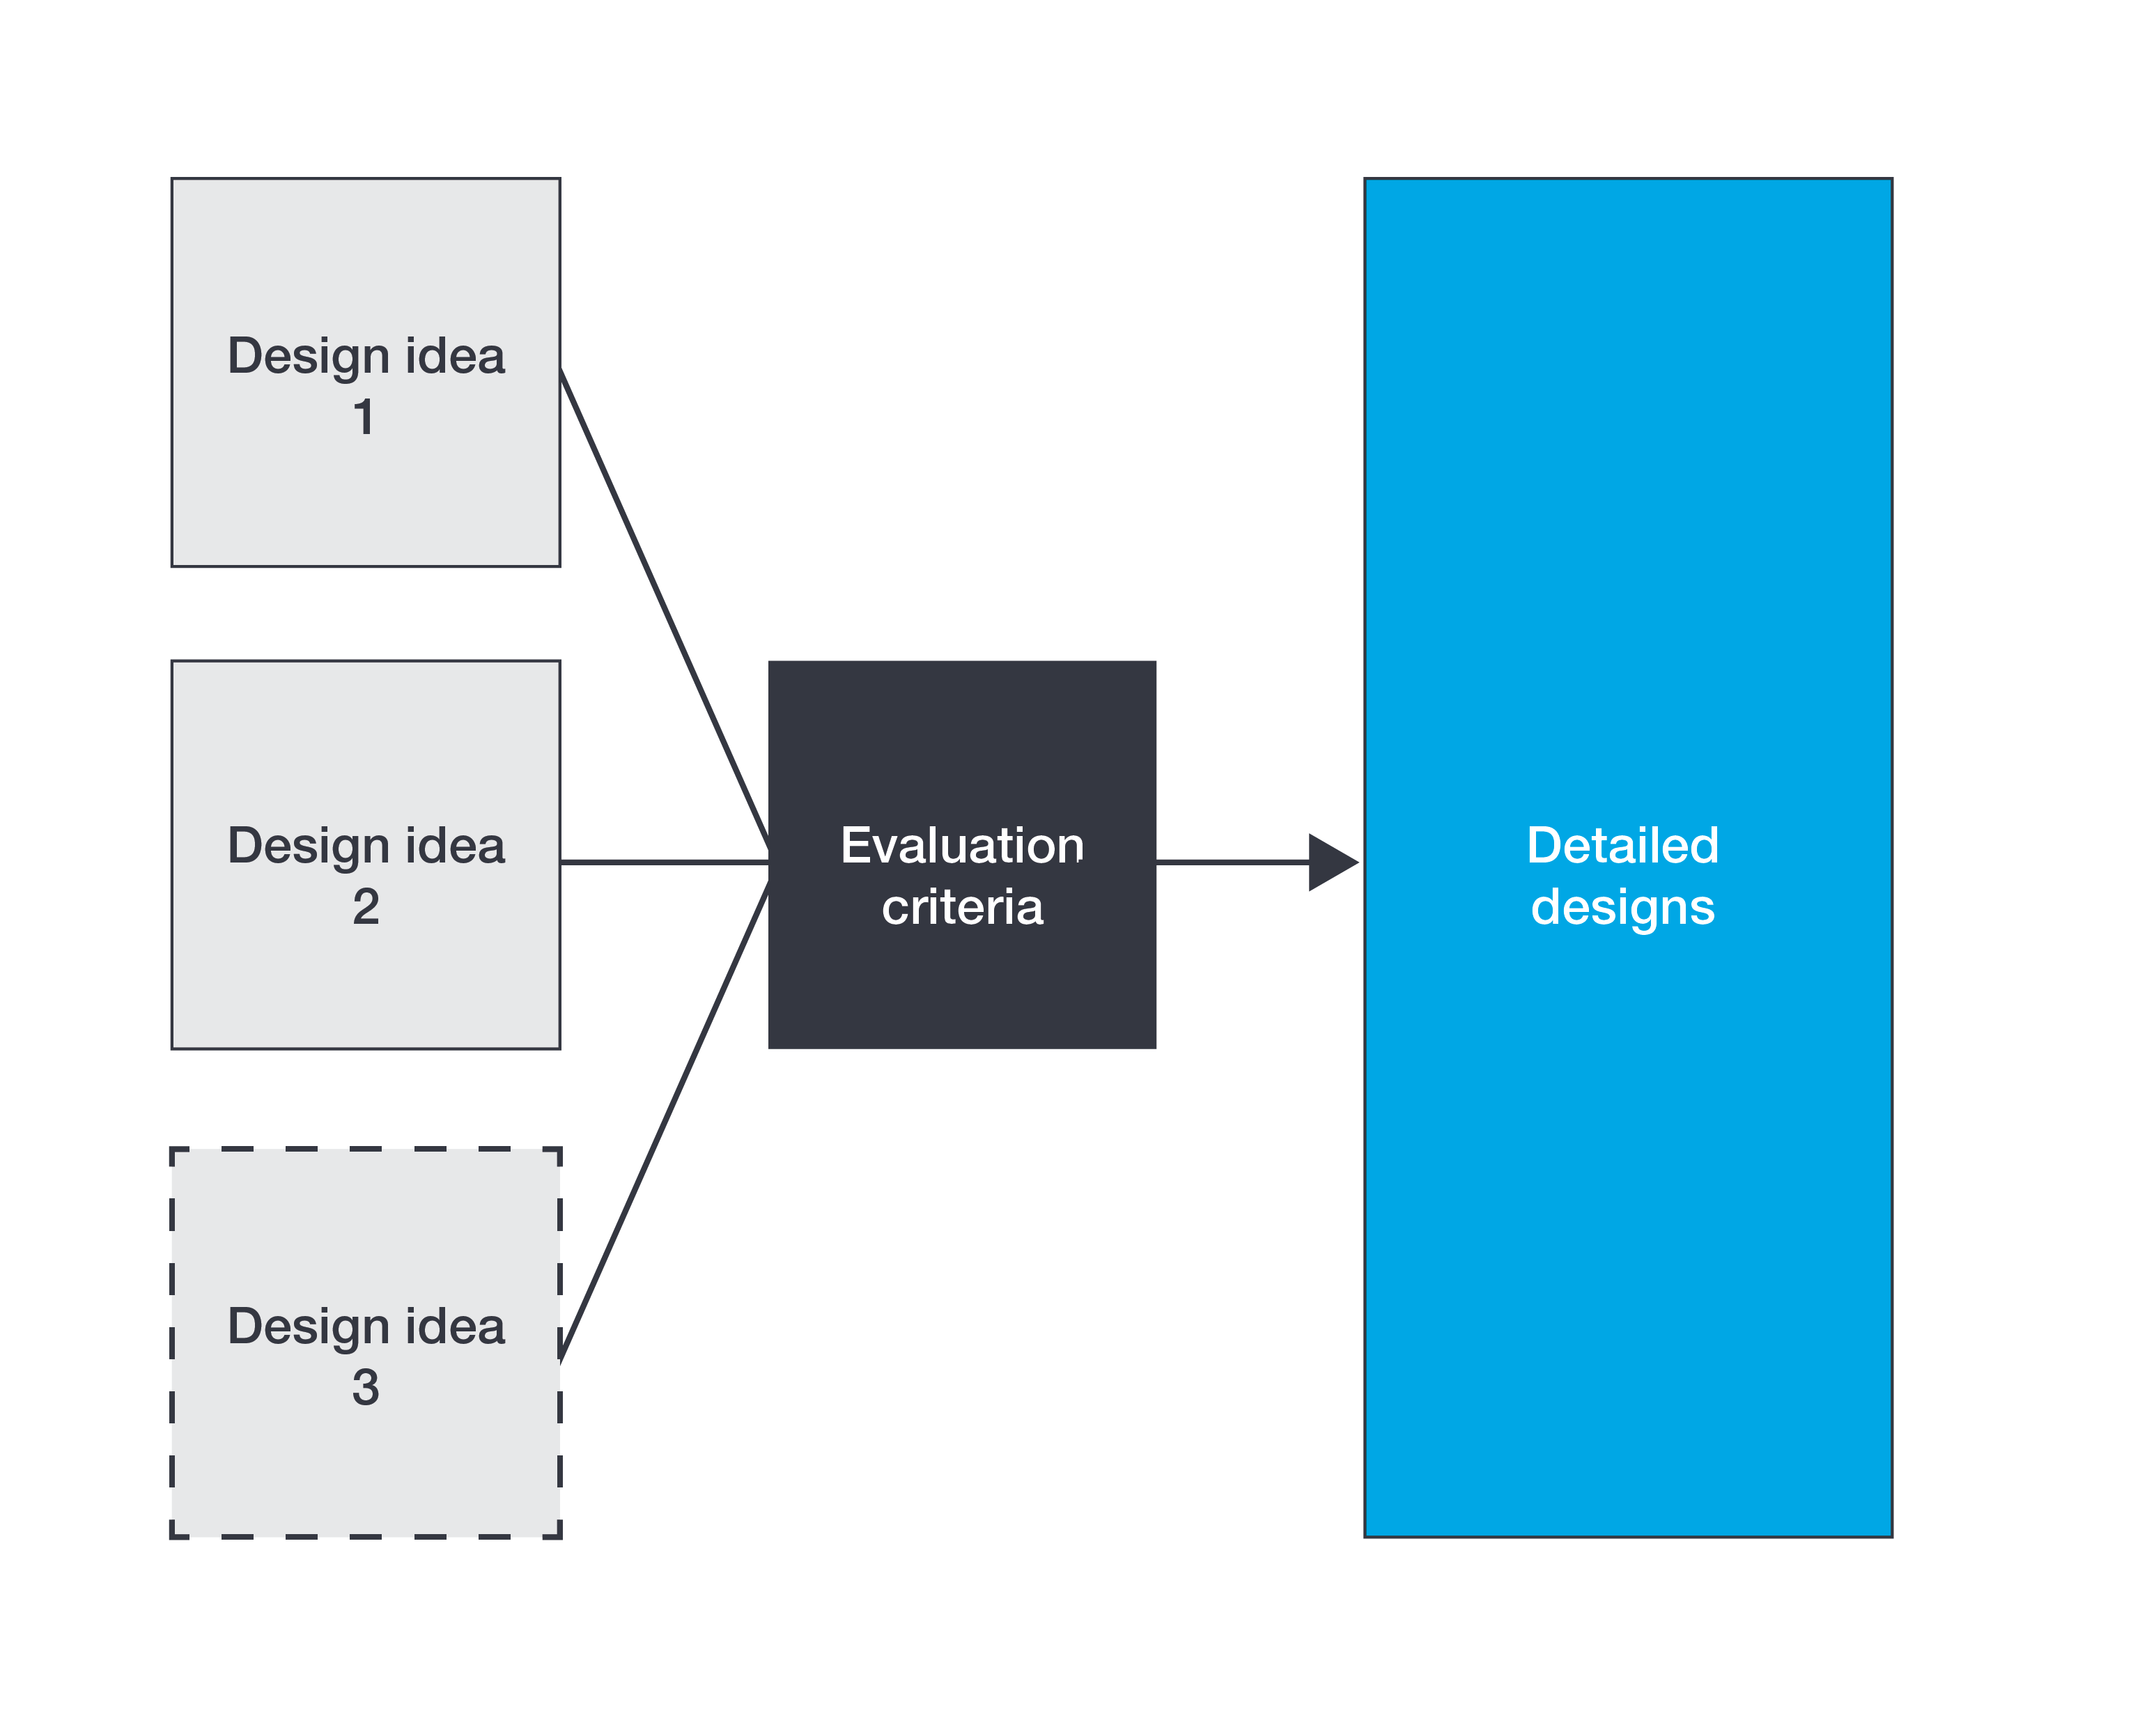
Figure 2: Process for designing infographics or dynamic data visualisations
Image description
Preparation for future testing should be considered by students in line with the problem-solving methodology recommendations for the solution design activity:
- Design tests to ensure the solution will achieve what it is intended to do.
- Determine what tests need to be performed, what test data needs to be included and the expected result after the test is conducted.
Managing the project throughout Unit 3 Outcome 2
The activities in this area of study need to be managed by the student as part of their project plan, which requires the use of monitoring their progress in order to remain on track with meeting all the identified milestones throughout the School-assessed Task.
Issues identified after marking Unit 3 Outcome 2
If the detailed design generated and assessed in Unit 3 Area of Study 2 is incomplete or contains significant errors, students have the opportunity to make adjustments to their design. Teachers can provide feedback on the quality of the designs but the adjustments must be student initiated, not teacher directed. The modified design is not reassessed. However, this opportunity prevents negative consequential effects in the development stage in Unit 4 Outcome 1.
Unit 4: Area of Study 1 – Data analytics: development and evaluation
The second part of the SAT requires students to develop and evaluate the infographics or dynamic data visualisations to present the findings in response to the research question and assess the effectiveness of the project plan in monitoring progress.
Project management
Students are required to monitor, modify and annotate their project plan as they progress through the development and evaluation stages of the problem-solving methodology. This can include making adjustments to tasks, time allocations, as well as recording details in journals or work logs. Attention to detail throughout this process will enable students to better assess the effectiveness of the project plan in monitoring progress.
Development stage
The development stage of the problem-solving methodology requires students to develop their detailed designs from Unit 3 Outcome 2 into infographics or dynamic data visualisations.
In order to develop their infographics or dynamic data visualisations, see
page 8 and 9 in study design (docx - 357.7kb) students are required to use appropriate software tools to manipulate data that meets the
software tools and functions of the study. Appropriate functions, techniques and procedures for the selected software tools are to be used, along with techniques for creating the infographics or dynamic data visualisations and techniques for validating and verifying data. Students may choose to create either infographics or dynamic data visualisations. They do not create both.
There are a number of methods and techniques that students can use to achieve this requirement, from creating movies to using specialised software.
Solution testing
Students should robustly test their database, spreadsheet and infographics or dynamic data visualisation solutions to fully ensure that they meet the requirements of the area of study. Functionality and validation testing are expected to be documented through the use of testing tables. Testing tables are to include both expected and actual results, along with clear descriptions of the test to be performed and the test data to use in each test. Students should be encouraged to include in their documentation all tests that have failed, including actions and mitigations taken, in order to demonstrate the changes made as a result of a robust testing process.
Evaluation stage
Students should use their evaluation criteria developed in Unit 3 Outcome 2 when evaluating the efficiency and effectiveness of their infographics or dynamic data visualisations. The proposed evaluation strategy should evaluate the extent to which the infographics or dynamic data visualisations present the findings of the research question.
Students can complete this evaluation in a variety of ways:
- using a rubric and a comment section
- using a checklist incorporating functional and non-functional requirements
- writing a short report that includes comments on each criteria evaluated.
Throughout the SAT process, students should be collecting evidence to support the assessment of the project plan in managing the project. While not an exhaustive list, this evidence may take the form of progress journals, annotations to the project plan, screenshots of infographics or dynamic data visualisations, photographs of design iterations and annotated drafts of diagrams.