Teaching and Learning
Accreditation period Units 1-4: 2023-2027
Units 1-4 Sample learning activities
The VCE Foundation Mathematics Study Design 2023–2027 support materials provides teaching and learning advice for Units 1 to 4 or Units 3 and 4, and assessment advice for School-based Assessment in Units 3 and 4.
The program developed and delivered to students must be in accordance with the VCE Foundation Mathematics Study Design 2023–2027.
The detailed learning activities may form the basis of a mathematical investigation which may also be used for assessment, particularly at Units 3 and 4.
Unit 1
Unit 1 Area of Study 1: Algebra, number and structure
Examples of learning activities
- Undertake calculations using recipes as a stimulus. Investigate proportions of ingredients. Calculate ratios and apply to increasing or decreasing proportions. Use fractions in relation to the measurement of ingredients.
- Investigate calculations in regard to sports scores. Perform calculations involving integers and decimals.
- Investigate percentages as applied in the retail sector. Use retailer websites to examine pricing, including GST. Calculate percentage increases and decreases. Discounts and Uber surge pricing are good real-world examples.
- Discuss best buys, including the concept of cost per unit. Investigate costs and benefits to buying in bulk.
- Apply concepts of ratio with respect to industry trades. Consider proportions when making concrete (construction) or mixing hair dye (hairdressing).
- Undertake calculations of rates as applied to personal and industry transport. Consider changing units of time, distance and speed to develop understanding. Contextualise with freight transport and delivery deadlines.
- Undertake measurements in the local environment and use these as a tool to teach estimation, leading digit approximation and rounding.
- Play a series of dice or similar games to teach place value.
- Investigate very large distances, e.g. earth to sun as a means of understanding powers.
- Find the results and the ladder for a sporting competition or online game you are interested in investigating. Write up a report explaining and analysing how the order on the ladder is compiled, showing the calculations for awarding points and percentages.
- If you were given $10,000 to purchase a used car, what car would you buy? Why? Describe the car you would buy and why you wanted it.
- Undertake exchange rate calculations. Real-world examples include purchasing gaming currency (such as V-bucks) and foreign currency.
- Investigate and test the accuracy of hand-held measuring devices.
- Examine scales on house plans and maps. Scale up and scale down various diagrams/pictures.
- Investigate the maths required and involved in buying and flying a drone. What are the different features and benefits of different brands and models? Consider price, but also size, weight, battery life, flying capability, camera quality and so on. If you were buying a drone that costs less than $1000, what model would you buy and why? Look at Australia’s drone rules and restrictions, and how they are designed to keep everyone safe. Summarise and tabulate the different criteria for drones, explicitly identifying what mathematical knowledge and skills are needed to make sense of the information (e.g. number, measurement, shape and space, etc.).
Detailed example
Bone length
This example demonstrates how the three outcomes can be taught together using content from Area of Study 1: Algebra, number and structure. Outcomes provide the key knowledge and skills (Outcome 1), that are taught using a mathematical investigation (Outcome 2) and using technology (Outcome 3).
Can bone length be used to estimate height?
Mathematical content covered
Key knowledge
- numerals, symbols, number facts and operations and strategies for calculation such as calculating the height based on bone length.
Key skills
- make estimates and carry out relevant calculations using mental and by-hand methods
- use technology effectively for accurate, reliable and efficient calculations
- solve practical problems which require the use and application of a range of numerical computations
- check for accuracy and reasonableness of calculations and results such as comparing calculated heights against actual heights to determine accuracy of formulas.
Identifying the context for the investigation
Forensic anthropology is the examination of human skeletal remains for law enforcement agencies to determine the identity of unidentified bones. A forensic anthropologist can assist investigators by assessing characteristics such as age, sex, height (calculations of length of bones can be used to predict height), ancestry, disease and trauma. The focus of this activity will be to use bone lengths, in particular the femur (upper leg), tibia (lower leg) and humerus (upper arm) to calculate the height of an individual. Occasionally, only a bone or two is found and forensic anthropologists may narrow down the missing person list to people of a certain height before further analysis can be undertaken to identify the human remains.
The following table contains the formulas that may be used to calculate height (cm) of males and females from given bone lengths:
| Bone length | Height (male) | Height (female) |
|---|---|---|
| Femur (upper leg) | femur length x 2.238 + 69.089 | femur length x 2.317 + 61.412 |
| Tibia (lower leg) | tibia length x 2.37 + 80.97 | tibia length x 2.6 + 65.63 |
| Humerus (upper arm) | humerus length x 2.99 + 72.42 | humerus length x 3.22 + 61.32 |
However, it only gives an estimate of height. But how good are the formulas at predicting height? Is it better for a particular bone or a particular sex?
Explore the problem mathematically
Below is a table of bone lengths and height calculations for ten males and ten females. Use the tables to determine which bone or sex is the best predictor of height. Test the reasonableness of this result by collecting your own data to back up your own conjecture. Your conjecture may relate to particular bone or sex differences. You should consider the reasonableness of these results and the effect of sample size.
Male
| Person 1 | Person 2 | Person 3 | Person 4 | Person 5 | Person 6 | Person 7 | Person 8 | Person 9 | Person 10 | |
|---|---|---|---|---|---|---|---|---|---|---|
| Femur | 55 | 48 | 43 | 46 | 50 | 47 | 51 | 5 | 42 | 48 |
| Tibia | 48 | 41 | 34 | 39 | 40 | 40 | 40 | 41 | 37 | 43 |
| Humerus | 35 | 38 | 33 | 36 | 38 | 35 | 38 | 36 | 34 | 36 |
| Height | 190 | 183 | 165 | 171 | 179 | 174 | 180 | 184 | 166 | 174 |
Female
| Person 1 | Person 2 | Person 3 | Person 4 | Person 5 | Person 6 | Person 7 | Person 8 | Person 9 | Person 10 | |
|---|---|---|---|---|---|---|---|---|---|---|
| Femur | 54 | 52 | 43 | 47 | 48 | 43 | 47 | 51 | 48 | 44 |
| Tibia | 48 | 40 | 36 | 39 | 35 | 35 | 40 | 40 | 41 | 36 |
| Humerus | 42 | 39 | 34 | 36 | 34 | 35 | 35 | 38 | 34 | 34 |
| Height | 190 | 183 | 165 | 171 | 179 | 168 | 174 | 180 | 184 | 166 |
Determine the mean of the absolute values of differences for male students and / or female students for predictions of height for one and / or each bone.
Calculate the percentage error for your table of results and your individual results.
What graph or other visual representation is most appropriate to present this data?
Communicate the results
Your report should include the following:
- An introduction to the problem
- Mathematical findings
- Analysis and interpretation of the results, including:
- What do your results show?
- Were your conjectures regarding which bone or gender difference correct?
- Do your results show this?
- Comment on the reasonableness of your results.
- Were there any errors associated with your results or data collection method?
- Comment on the appropriateness of the size of sample.
- Comment on the validity of a height prediction using the formulas for predicting height
Unit 1 Area of Study 2: Data analysis, probability and statistics
Examples of learning activities
- Collect data from your local sports team to answer key questions about training days, times and uniform requirements. Present the data and summarise the findings in context. Relate the findings back to provide a solution to the original questions.
- Investigate sports statistics of your favourite AFL players and teams. Pick a specific skill and calculate relevant statistics, such as measures of centre and spread. Create data displays such as bar graphs or pie charts and use these to discuss the strengths and weaknesses of players and teams.
- Use the internet to find historical Australian weather data and connect this data to key events such as droughts, floods, bushfires etc. Discuss the implications of these events for weather-dependent industries (farming and hot air ballooning are good examples).
- Does Victorian public transport run on time? Investigate this question by collecting primary data or interpreting publicly available data. Are specific performance benchmarks or targets being met? Discuss the limitation of the data and suggest improvements to the data collection and reporting processes. Present findings in the most appropriate form. Relate these findings to real life and write a mock newspaper article discussing the findings.
- Watch That sugar film. Consider how nutritional information is represented on food packaging. Consider the sugar content of a range of common foods in your fridge and pantry (e.g. breakfast cereals, muesli bars, soft drinks, chocolate biscuits, etc.). How might you apply mathematics to meaningfully represent the sugar content of these foods? Prepare an infographic to present your findings, including graphs and charts.
- Find a news or media article (online or hard copy) that presents and requires the interpretation of a range of statistical information. Get students to critique the use of data. What message is the headline giving? Who is the author, and might they be biased? Whose perspectives are being reported? Are there misrepresentations or omissions? Are their arguments supported by the statistics?
Detailed example
Sleep and memory
This example demonstrates how the three outcomes can be taught together using content from Area of Study 2: Data analysis, probability and statistics. Outcomes provide the key knowledge and skills (Outcome 1), that are taught using a mathematical investigation (Outcome 2) and using technology (Outcome 3).
Does the amount of sleep you have affect your memory?
Mathematical content covered
In this investigation, students investigate types of data, common measures of central tendency and spread, and characteristics and properties of data sets and the shape of their distributions.
Key knowledge
- key features and conventions of diagrams, charts, tables and graphs
- purposes for using different forms of data representation and types of data scales (categorical and numerical)
- common measures of central tendency (mean, median, mode) and of spread (range, quartiles)
- characteristics and properties of data sets and the shape of their distributions
- terminology and language for description, comparison and analysis of data sets, graphs and summary statistics.
Key skills
- accurately read and interpret tables and graphs about memory task performance and hours of sleep
- summarise statistical data and determine commonly used measures of central tendency and of spread to compare memory performance and hours of sleep
- describe, compare and analyse data sets and report on any trends, implications or limitations.
Identifying the context for the investigation
Twenty students performed a Memory test (Note: the higher the level, the better they performed). Their results are shown below. Predict how much sleep you think the students below had, based on their results on the test.
Explore the problem mathematically
Collect student data using the table below and then decide on the best method of graphical display.
Consider which methods of centre and spread will help make sense of data and make calculations as required.
Consider the implications or limitations of the data; for example, does the moment of sleep affect your memory?
Table 1: Memory Performance level from random sample of 20 students
| Student | Memory Task Performance (level) | Hours of sleep |
|---|---|---|
| 1 | 16 | |
| 2 | 9 | |
| 3 | 7 | |
| 4 | 23 | |
| 5 | 18 | |
| 6 | 17 | |
| 7 | 15 | |
| 8 | 21 | |
| 9 | 17 | |
| 9 | 20 | |
| 11 | 17 | |
| 12 | 18 | |
| 13 | 21 | |
| 14 | 19 | |
| 15 | 19 | |
| 16 | 17 | |
| 17 | 2 | |
| 18 | 19 | |
| 19 | 14 | |
| 20 | 15 |
Communicate the results of the problem
Your report should address the following question:
- How was data collected? Provide a complete description of the process. For example, is the data drawn from primary or secondary sources?
- Are there any outliers in the data? If there are outliers, how does this affect the interpretation of the data?
- Calculate mean, mode, range and median (for both sleep and memory). What type of data is presented in the graph? What does this data show? Which is the most appropriate measure to meaningfully describe this data set?
- How reliable are the results? Are your findings what you expected? Why / why not?
Unit 1 Area of Study 3: Discrete mathematics Financial and consumers mathematics
Examples of learning activities
- Research Medicare or NDIS rebates. For example, find out what your GP charges for a standard consultation and estimate the Medicare rebate that applies. Check your calculation.
- Investigate and explain the Medicare Levy Surcharge. Create a spreadsheet that presents different income scenarios and calculates any additional tax that must be paid.
- Explain the reasons for a progressive tax scale in Australia. What services and facilities are paid for by tax according to council, state or federal funding?
- Consider sample tax returns and examine the mathematical calculations required by the taxpayer completing their personal return and looking for tax deductions. Refer to resources.
- Undertake a series of calculations based around credit card statements. Include interest charged and unexpected charges. Use Moneysmart for starter ideas and videos.
- Investigate the cost structure of different buy now pay later services. Perform calculations to demonstrate the ‘best case’ and ‘worst case’ ways of using these payment services, in terms of total costs.
- Investigate payday lending schemes and undertake a series of interest calculations. Discuss the pros and cons of these types of loans from a financial perspective.
- Explain the legal requirements of a payslip, identifying key features and calculations. Ask students to double-check their own payslips, including standard vs penalty rates, tax deducted, superannuation paid and leave entitlements.
- Investigate other forms of income: wages, salaries, piece of work, retainers, commission, overtime, rewards, overtime, allowances etc.
- Explain the concept of salary sacrifice or salary packaging. What calculations underpin these schemes? What are the benefits to the individual? Are there any flow-on effects?
Detailed example
Making money!
This example demonstrates how the three outcomes can be taught together using content from Area of Study 3: Discrete mathematics Financial and consumer mathematics. Outcomes provide the key knowledge and skills (Outcome 1), that are taught using a mathematical investigation (Outcome 2) and using technology (Outcome 3).
Making money!
Mathematical content covered
In this investigation students investigate sources of income.
Key knowledge
- income payments and calculations such as casual versus permanent employment, rates of pay, pay scales and payslips
- financial systems and related calculations such as personal taxation, GST and superannuation.
Key skills
- describe, calculate and interpret different income related taxes, payments and deductions and their impact on income, such as pay scales, personal tax, withholding tax, PAYE and PAYG.
Identifying the context for the investigation
Over a student’s lifetime they will earn, save, borrow and invest money to satisfy the myriad of consumer demands of a modern democratic society.
Begin the investigation by brainstorming with your students the following key questions:
- How much does an average person in Australia spend over a lifetime?
- List all the different ways you can earn money.
- List all the different types of employment in Australia.
Ask students to look up the hourly minimum wage in Australia. Convert this to a:
- daily wage
- weekly wage
- monthly wage.
As a class, research the minimum award across different industries at Fairwork.
Explore the problem mathematically
Begin by asking students to consider what jobs / industries they predict will be in-demand (and therefore provide secure employment) in future years. Pick a job / industry from this brainstorm.
Next, introduce students to a sample payslip, pointing out all the key features that are required by law in Australia. Sample payslips can be found at (WORD templates are on this webpage).
Ask students to refer to Fairwork and design a pay slip for a position using the information given in the award. This detailed pay slip should include:
- the type of employment
- the pay period (determine this in consultation with the teacher)
- the gross pay and net pay for the pay period
- the tax withheld for the pay period
- the superannuation contributed by the employer for the pay period
- any allowances and deductions for the pay period.
As they create this payslip, students undertake a series of calculations to determine the amounts displayed on the document that they are creating.
To extend upon this research, ask students to investigate the wages earned, taxation applied, and superannuation saved over the course of one’s career. Make some assumptions, including years of full-time, part-time and interrupted work; the current progressive tax scale applies; and an average of 12% superannuation. Ask students to predict how much they would like to earn each year. And in a lifetime?
- Calculate the estimated accumulated gross wages that might be earned. Don’t forget to consider how rates of pay change with years of service.
- Calculate the estimated superannuation that might be saved. Don’t forget to consider investment growth.
- Apply the tax rate to this remaining amount to give an approximation of net pay and total tax paid over one’s working life. Students should learn to look up the pay rates on the ATO and to use a taxation calculator.
- Discuss the results. Are they surprised or not? Do they think that they could be financially independent and secure in this career? Consider living standards, including housing costs?
Communicate the results of the problem
Students should present their pay slip design using technology such as PowerPoint or another presentation software.
They should also have additional pages detailing all calculations and processes demonstrating their mathematical thinking. These might be compiled in a spreadsheet.
They should include screenshots of any technology used in their calculations.
Unit 1 Area of Study 4: Space and measurement
Examples of learning activities
- How many fresh oranges does it take to make a 2-litre container of orange juice? Which is cheaper – freshly squeezed or store-bought orange juice – and why?
- Choose your favourite recipe from home, a cookbook or the internet and bring it to class. Using the recipe you found, calculate how much of each of the recipe’s ingredients you need to cook for a group of 20 people. Use the new list of ingredients to prepare a budget. How much will it cost you to purchase all the ingredients to make the food? What is the cost per person? How would this compare with eating similar food out at a restaurant or café?
- Investigate and explain the fuel economy ratings of different modes of transport. A vehicle's fuel economy is measured in litres per 100 kilometres. Provide comparative figures for different types of vehicles, such as a motor bike versus a small car versus a truck or bus. Give examples of how far each vehicle could travel on the same amount of fuel.
- Interpret house plans and calculate the amount of paint, carpet, tiling it would take to do a complete makeover in readiness for sale. Prepare a spreadsheet that presents an itemised proposal and budget outlining the costs.
- Investigate the packaging of five supermarket items. If you had a box that was 50 cm x 50 cm x 50 cm, how many items could you fit into this box? What would be the perfect size box to hold 10 items without wasted space?
- Calculate stopping distance in cars from skid marks.
- Plan to build a community garden in your school or for a local community group. Draw detailed plans including scale drawings and all measurements. Extend this investigation by costing materials and work for the project.
Detailed example
Garden design
This example demonstrates how the three outcomes can be taught together using content from Area of Study 4: Space and Measurement. Outcomes provide the key knowledge and skills (Outcome 1), that are taught using a mathematical investigation (Outcome 2) and using technology (Outcome 3).
Garden design
Mathematical content covered
Key knowledge
- metric units for length, area, volume, capacity, time, mass, temperature and common derived units
- standard formulas for calculating length, area, surface area, volume and capacity such as area of garden beds and water features.
Key skills
- calculate and interpret length, area, surface area, volume, capacity and duration for a range of personal, societal or workplace measurement problems with use of estimation, rounding and approximation strategies
- identify and use common metric and other relevant measurements
- convert between a range of standard metric units
- estimate and measure different quantities using appropriate measurement tools, such as estimating the amount soil and pebbles required to cover a space.
Identifying the context for the investigation
You are a landscape designer who has been asked to develop a fully budgeted project proposal for a potential client’s garden. The client has bought a house, which has a flat un-developed rectangular backyard of dimensions 15 metres by 24 metres (see the diagram below). The client wishes it to be re-developed over a two-week period according to an interesting and practical design for outdoor living and entertainment, within a total budget of $ 70,000.
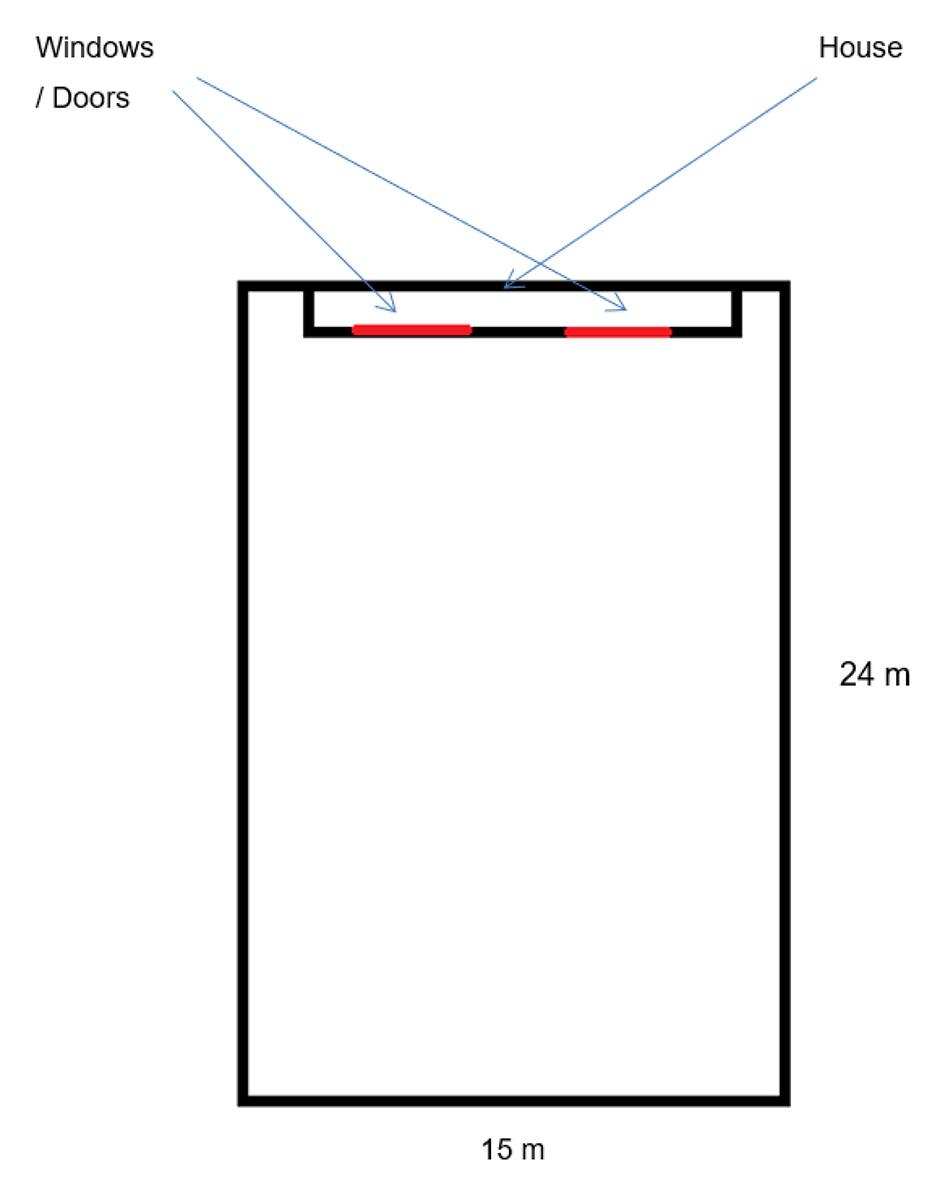
The perimeter of the backyard should be fenced on three sides, with one short side backing onto the house. Any pool or pond must be fenced. Labour costs are estimated at an hourly rate of $25.00 per hour. You hire two friends plus yourself to carry out the work. The job will take five days to complete, assuming 8 hours a day on average. The costs of some materials are given below:
| Ground cover | Plants | Garden Features | Furniture |
|---|---|---|---|
| Pavers ($20 per m2) | Flax plants (4 plants per m2 @ $20 each) | Pool ($1000 per m2) | BBQ ($600 needs 2 m2) |
| Decking ($50 per m2) | Ferns (4 plants per m2 @ $10 each) | Pond ($200 per m2) | Table and chairs ($600 for 6 chairs needs 4 m2) |
| Grass ($10 per m2) | Conifers (1 plant per m2 @ $25 each) | Fountain / water fountain ($1000 per m2) | Table and chairs ($800 for 8 chairs needs 6 m2) |
| Synthetic grass ($25 per m2 ) | Fruit trees (1 plant, 4 m2 @ $40 per m2) | Gazebo ($1500 per m2) | Table and chairs ($1200 for 12 chairs needs 10 m2) |
| Bark ($15 per m2) | Hedging (2 plants per m2 @ $15 per m2) | Pool fencing (glass) \$150 per m (pool gate 1 m \$200) | Bench seat ($150 needs 2 m2) |
| New concrete path ($56 per m2) | Roses (1 plant per m2 @ $35) | Perimeter paling fence ($80 per m) | Outdoor kitchen ($2000 per m2) |
| New concrete path (Coloured) ($64 per m2) | Picket fence (100 per m) | Patio heater ($300) | |
| Slate impression concrete ($75 per m2) | |||
| Stencilled concrete ($82 per m2) |
Other materials may be used, for example sleepers, feature rocks, pebbles, statues, water features, sails (see Garden design or Home improvements).
Explore the problem mathematically
This task requires three parts:
- A scaled garden design with key describing any features. There are various online design programs that might be used.
- An invoice for the client that includes the itemised cost of materials plus labour.
- A basic schedule for completion (timeline) for the garden project.
Communicate the results of the problem
Prepare a multimedia presentation for the potential client. Your report should include the following:
- An introduction to the design concept.
- Mathematical findings including costings, design layout and schedule.
- Analysis and interpretation of the results:
- discuss the reasonableness of the quote
- any potential problems or issues or errors that may occur that would add to the project’s cost.
Unit 2
Unit 2 Area of Study 1: Algebra, number and structure
Examples of learning activities
- Investigate and compare two or three sports. Consider the duration of the game, time allowed for stoppages / breaks, the number of players, replacement strategies for injured or resting players, and infringement penalties. Prepare a report that applies mathematics to summarise the similarities and differences.
- Investigate and analyse the scoring system for your favourite sport and generalise the scoring into an algebraic sentence and equation. Write (and draw / illustrate) an explanation for the scoring in the game for someone who has never seen a game of this sport before.
- Investigate different companies’ equipment hire rates, including for delivery and pickup. For example, the cost of hiring a commercial-grade ride-on lawn mower from one company might be \$185 per day, plus a fee of \$75 for delivery and pick up. Investigate how much it would cost to hire the lawn mower for different lengths of time (in days) and write this as an algebraic formula. Compare the costs and the formula if you could do the delivery and pick up yourself. For each formula, work out how many days you could hire the lawn mower for a maximum total cost of $1000.
- Use the formula for speed in terms of distance and time to compare at least three different animals (or birds). Evaluate how fast they can travel, and how far they can get in a specified time. Write a report about your findings, showing your calculations using the speed, distance, time formula.
- Research and investigate taxi and Uber fares in Victoria. How are fares do you calculate? Can you generalise a formula? Draw on mathematics to explain different scenarios (routes, times and distances) and recommend which transport option offers the best value.
- Use the formula for the perimeter and area of rectangles to compare at least three different rectangular sport playing fields that are located at your school or in your community (for example, basketball, netball, soccer, hockey, tennis etc.). You will need to use appropriate measuring tools (e.g. trundle wheels or apps) to measure the dimensions. Report your results, including illustrations (drawing and / or photos), calculations and an explanatory written statement of your findings.
- Research the use and application of ratios in colouring hair. Mixing hair dye and developer is based on using different ratios to create different shades and colours. Write up a report on how ratios are used and give some examples of how this works.
- Investigate different ‘salary plus commission’ pay arrangements for salespeople earning a fixed base rate plus a percentage of sales income they generate (a good example is real estate agents). Write up at least two different variations and create a generalised formula for each one. Work out what payments would be received for a number of different sales over different periods of time. What are the benefits and risks associated with such pay arrangements?
Detailed example
Sales commission
This example demonstrates how the three outcomes are taught together using content from Area of Study 1: Algebra, number and structure. Outcomes provide the key knowledge and skills (Outcome 1), that are taught using a mathematical investigation (Outcome 2), and with the use of technology (Outcome 3).
Mathematical content covered
In this investigation and activity, the focus is on using and applying mathematical content taken from Area of Study 1: Algebra, number and structure.
Outcome 2: Key knowledge
- numerals, symbols, number facts and operations and strategies for calculation
- basic conventions of formal mathematical terminology, notations and processes in relevant symbolic expressions and formulas
- concepts of constant, pro-numeral, variable and formula.
Outcome 2: Key skills
- form estimates and carry out relevant calculations using mental and by-hand methods
- develop simple formulas describing generalisations, patterns and relationships between real-life variables
- solve practical problems using constants, symbols, variables, common formulas, expressions and equations
- check for accuracy and reasonableness of calculations and results.
This worked example follows the same problem-solving cycle for undertaking an investigation:
- formulating the problem and planning what maths to use and how
- exploring and doing the maths required to solve the problem at hand
- communicating the results and outcomes of the investigation.
Identifying the context for the investigation
When people work in areas that involve sales, such as in car sales, real estate and more, it is common that they are paid on what is called a commission basis. This example looks at how sales commissions operate and the maths sitting behind them.
Formulate the question or problem to be investigated
The starting point is the need to investigate how sales commissions work, and who might get paid by commission. It would be possible, for example, for teachers to help start the conversation and structure and guide the project work by inviting someone who is a salesperson to come in and talk to the group about how they get paid – in their current job or in previous or other sales jobs they know of. Alternatively, students can research about being paid commission on the internet.
Initial questions to be posed could include:
- Why might a commission approach be used?
- What are the advantages and disadvantages? For the business? For the employee?
- What are some common, but different methods used for calculating how a person gets paid on commission?
- What are some examples of rates that commissions are paid?
After the initial introduction about what sales commissions are and how they work, students need to be focused on what specific questions they need to attempt to solve and answer. Different students may choose slightly different sets of questions to investigate, but the teacher needs to ensure that the different sets of questions still cover the same set of required areas of study and the three outcomes.
The key questions are:
- What maths calculations are used when working out sales commissions?
- How can this be generalised and used for calculating and comparing different sales commissions?
Relevant background information
A commission is the amount of money paid to an employee for selling something. It's usually based on a percentage on sales income, but there are a range of different approaches and methods used. For Units 1 and 2 of VCE Foundation Mathematics, the types of sales commissions that should be investigated should be restricted to straightforward sales commissions, such as:
- Paid solely on a commission basis – that is, a proportion of sales made
- A combination of a fixed base amount (sometimes referred to as a retainer) plus commission on sales.
Explore the problem mathematically
The second stage is to then undertake the mathematical aspects of the investigation. The teacher may well need to work with students to refine their questions and the approach to be followed.
For example, some more specific issues and questions to research and investigate could be:
- Find a number of examples and cases for calculating and comparing different sales commissions.
- Can you create at least two different mathematical formulas for calculating sales commissions?
- Can you describe your different formulas in terms of the language of mathematics – that is, in terms of constants, pro-numerals, variables?
- Can you compare the two different ways of paying commissions and their formulas? What are the differences – and are the variables and constants different or the same?
- Use your formulas to calculate income and salaries for a range of different scenarios and situations based on sales commissions.
- Input your formulas into a spreadsheet for calculating the income based on different commission rates.
- If they were to be paid on commission which formula would they prefer, and why?
Negotiate with students on how they might work through this logically and develop a process for formalising the calculations into a formula, and inputting this into a spreadsheet.
Communicate the results of the problem
Students should write up and present the findings of their investigation into sales commissions and how they were able to represent them as formulas and use the formulas to calculate sales income.
They may choose to write a report or create a multimedia presentation that explains how sales commissions work and how they developed their formulas.
Students could consider addressing the following in their report:
- how sales commissions work
- how the formulas work and how they differ
- include examples of different income for different levels of sales and payment rates.
Unit 2 Area of Study 2: Data analysis, probability and statistics
Examples of learning activities
- Research and find the statistics for two different players in the same team in a favourite sport in at least ten different games in the same competition year and compare the two results. Write up a report on the comparison including representing the data graphically and using summary statistics.
- Investigate and analyse world record performances in a particular event or sport over the last ten years comparing men’s and women’s records and performances (e.g. times, distances, winning margins) and produce a report, including graphs analysing the changes over that period.
- Undertake an investigation into the constituent ingredients in high energy drinks. Consider the amounts and percentages of each ingredient on the data panel provided on the drinks. Compare and contrast the amounts of sugar, energy etc. Make recommendations based on your findings.
- Investigate and analyse fitness data from an application on a smart device. Analysis of heart rate / pulse rate before, during and after exercise. Comparison of elevation map and heat rate.
- Investigate overfishing statistics. Consider methods of data collection and veracity. Discuss data that has been collected by various bodies (government agencies, environmental not-for-profits). Compare and contrast findings.
- Analyse Victorian housing sale and rent prices over the last 25 years. Consider the most relevant ways to collect and present data. Use this data to investigate measures of central tendency and spread for key questions in relation to the data. What trends do you notice and how might these be explained?
- Explore climate change data from verifiable sources such as CSIRO. Understand the methods of data collection and the responsibilities of the scientists in relation to the data, sharing of data and reporting of results. Describe the data and make a report on the data trends. Discuss the implications of the findings.
- Research and compare physical attributes of professional sports people in two different sporting codes (AFL and basketball are good examples). Research, analyse and represent the data in a way that makes it easy to identify key differences.
Detailed example
Toughest race in the world!
Mathematical content covered
Key knowledge
- categorical and numerical data
- common measures of central tendency (mean, medium, mode) and simple measures of spread (range, quantiles, interquartile range)
- characteristics and properties of data sets and their summary data and the shape of their distributions
- terminology and language for description, comparison and analysis of data sets, graphs and summary statistics.
Key skills
- accurately read and interpret diagrams, charts, tables and graphs for categorical and numerical data
- summarise statistical data and calculate commonly used measures of central tendency and spread
- describe, compare and analyse data sets and summary data and report on any trends, implications or limitations.
Identifying the context for the investigation
The toughest foot race in the world is considered to be the Marathon des Sables. This 6-day race across 250 kilometres of the inhospitable Sahara Desert has claimed the lives of contestants as they struggle through hot endless dunes, sandstorms, temperatures over 50 degrees, and total isolation. Runners are only allowed to use the supplies that they carry on their backs, and the race attracts the toughest runners in the world hoping to prove themselves as best. Marathon des Sables
Ask students to watch a video of sections or highlights of the race to set the context and generate excitement.
Consider the following data set of the top 60 runners to the year 2022.
| Rank | Performance | Runner name | Nationlity | Year of birth | M/F | Rank M/F | Average Speed km/h | Age graded performance |
|---|---|---|---|---|---|---|---|---|
| 1 | 18:31:24 h | Runner 1 | MAR | 1982 | M | 1 | 12.795 | 18:18:18 h |
| 2 | 18:39:48 h | Runner 2 | MAR | 1992 | M | 2 | 12.699 | 18:39:48 h |
| 3 | 19:21:20 h | Runner 3 | MAR | 1995 | M | 3 | 12.245 | 19:21:20 h |
| 4 | 19:38:56 h | Runner 4 | MAR | 1969 | M | 4 | 12.062 | 17:36:27 h |
| 5 | 19:43:47 h | Runner 5 | ITA | 1986 | M | 5 | 12.012 | 19:42:29 h |
| 6 | 20:07:51 h | Runner 6 | FRA | 1971 | M | 6 | 11.773 | 18:30:38 h |
| 7 | 20:47:24 h | Runner 7 | MAR | 1975 | M | 7 | 11.400 | 19:45:47 h |
| 8 | 21:16:06 h | Runner 8 | MAR | 1981 | M | 8 | 11.143 | 21:01:03 h |
| 9 | 21:33:24 h | Runner 9 | ESP | 1976 | M | 9 | 10.994 | 20:39:36 h |
| 10 | 21:40:37 h | Runner 10 | FRA | 1990 | M | 10 | 10.933 | 21:40:37 h |
| 11 | 21:48:06 h | Runner 11 | FRA | 1980 | M | 11 | 10.871 | 21:26:47 h |
| 12 | 22:33:36 h | Runner 12 | NED | 1979 | F | 1 | 10.505 | 21:52:52 h |
| 13 | 22:35:29 h | Runner 13 | MAR | 1968 | M | 12 | 10.491 | 20:14:39 h |
| 14 | 22:58:08 h | Runner 14 | GBR | 1978 | M | 13 | 10.318 | 22:20:15 h |
| 15 | 22:58:27 h | Runner 15 | ITA | 1982 | M | 14 | 10.316 | 22:47:26 h |
| 16 | 23:58:54 h | Runner 16 | FRA | 1988 | M | 15 | 9.883 | 23:58:54 h |
| 17 | 24:00:42 h | Runner 17 | ESP | 1977 | M | 16 | 9.870 | 23:11:26 h |
| 18 | 24:07:01 h | Runner 18 | MAR | 1974 | M | 17 | 9.827 | 22:44:15 h |
| 19 | 24:07:22 h | Runner 19 | ESP | 1977 | M | 18 | 9.825 | 23:17:53 h |
| 20 | 24:07:59 h | Runner 20 | BEL | 1983 | M | 19 | 9.821 | 24:00:45 h |
| 21 | 24:27:50 h | Runner 21 | FRA | 1991 | M | 20 | 9.688 | 24:27:50 h |
| 22 | 25:00:56 h | Runner 22 | FRA | 1989 | M | 21 | 9.474 | 25:00:56 h |
| 23 | 25:00:58 h | Runner 23 | GBR | 1981 | M | 22 | 9.474 | 24:43:16 h |
| 24 | 25:01:26 h | Runner 24 | MAR | 1975 | M | 23 | 9.471 | 23:47:16 h |
| 25 | 25:16:36 h | Runner 25 | FRA | 1980 | M | 24 | 9.376 | 24:43:51 tt |
| 26 | 25:17:31 h | Runner 26 | MAR | 1986 | F | 2 | 9.371 | 25:15:51 h |
| 27 | 25:23:45 h | Runner 27 | GBR | 1989 | M | 25 | 9.332 | 25:23:45 h |
| 28 | 25:24:11 h | Runner 28 | GBR | 1990 | M | 26 | 9.330 | 25:24:11 h |
| 29 | 25:33:36 h | Runner 29 | AUS | 1964 | M | 27 | 9.272 | 22:06:34 h |
| 30 | 25:36:55 h | Runner 30 | FRA | 1988 | M | 28 | 9.252 | 25:36:55 h |
| 31 | 25:37:51 h | Runner 31 | AUS | 1973 | M | 29 | 9.247 | 23:46:03 h |
| 32 | 25:48:16 h | Runner 32 | MAR | 1976 | M | 30 | 9.184 | 24:43:52 h |
| 33 | 26:04:10 h | Runner 33 | GBR | 1979 | F | 3 | 9.091 | 25:26:10 h |
| 34 | 26:12:24 h | Runner 34 | FRA | 1980 | M | 31 | 9.044 | 25:46:47 h |
| 35 | 26:25:49 h | Runner 35 | FRA | 1969 | M | 32 | 8.967 | 23:53:26 h |
| 36 | 26:33:18 h | Runner 36 | GBR | 1989 | M | 33 | 8.925 | 26:33:18 h |
| 37 | 26:40:34 h | Runner 37 | NZL | 1972 | M | 34 | 8.884 | 24:44:13 h |
| 38 | 26:42:16 h | Runner 38 | FRA | 1971 | M | 35 | 8.875 | 24:33:18 h |
| 39 | 26:48:49 h | Runner 39 | JPN | 1979 | M | 36 | 8.839 | 26:14:04 h |
| 40 | 26:51:32 h | Runner 40 | GBR | 1973 | M | 37 | 8.824 | 25:06:48h |
| 41 | 26:56:33 h | Runner 41 | CRO | 1991 | M | 38 | 8.797 | 26:56:33 h |
| 42 | 26:57:01 h | Runner 42 | FRA | 1990 | M | 39 | 8.794 | 26:57:01 h |
| 43 | 27:03:54 h | Runner 43 | FRA | 1985 | M | 40 | 8.757 | 27:02:07 h |
| 44 | 27:06:43 h | Runner 44 | POL | 1977 | M | 41 | 8.742 | 26:11:05 h |
| 45 | 27:08:00 h | Runner 45 | FRA | 1972 | M | 42 | 8.735 | 24:56:57 h |
| 46 | 27:24:41 h | Runner 46 | BEL | 1994 | M | 43 | 8.646 | 27:24:41 h |
| 47 | 27:24:47 h | Runner 47 | ESP | 1982 | M | 44 | 8.646 | 27:11:38 h |
| 48 | 27:24:48 h | Runner 48 | ESP | 1974 | M | 45 | 8.645 | 25:50:44 h |
| 49 | 27:34:13 h | Runner 49 | FRA | 1969 | M | 46 | 8.596 | 24:55:15 h |
| 50 | 27:35:44 h | Runner 50 | GBR | 1986 | M | 47 | 8.588 | 27:35:25 h |
| 51 | 27:39:11 h | Runner 51 | GBR | 1989 | M | 48 | 8.570 | 27:39:11 h |
| 52 | 27:49:16 h | Runner 52 | GBR | 1985 | M | 49 | 8.519 | 27:47:26 h |
| 53 | 27:56:09 h | Runner 53 | ESP | 1971 | M | 50 | 8.484 | 25:28:09 h |
| 54 | 27:56:15 h | Runner 54 | GBR | 1985 | M | 51 | 8.483 | 27:54:25 h |
| 55 | 27:56:33 h | Runner 55 | GBR | 1970 | M | 52 | 8.482 | 25:28:31 h |
| 56 | 27:58:24 h | Runner 56 | GBR | 1975 | M | 53 | 8.472 | 26:35:30 h |
| 57 | 27:58:42 h | Runner 57 | ESP | 1988 | M | 54 | 8.471 | 27:58:42 h |
| 58 | 28:03:33 h | Runner 58 | FRA | 1965 | M | 55 | 8.446 | 24:16:17 h |
| 59 | 28:12:18 h | Runner 59 | ESP | 1987 | M | 56 | 8.403 | 28:12:18 h |
| 60 | 28:18:40 h | Runner 60 | NED | 1967 | M | 57 | 8.321 | 25:09:06 h |
| 61 | 28:29:13 h | Runner 61 | ESP | 1974 | M | 58 | 8.320 | 26:51:27 h |
Formulate the question or problem to be investigated using a statistical cycle
The cycle for this investigation will follow these steps: investigate the problem, plan for a solution, analyse the data, and draw conclusions from the data.
Ask students to consider the data that they have been given. They may also choose to investigate other data associated with the race, e.g. Statistical data on the Marathon des Sables.
Questions to consider when deciding how to interrogate the data include:
- What types of variables are present in the data? Categorical or numerical?
- Which variables are you interested in analysing?
- Can you identify a relationship between two variables?
- How might you best display these variables in a graph or chart? (Consider categorical or numerical norms for approaches)
- Which measures of centre and/or spread would make sense for the data you have chosen to analyse?
Explore the problem mathematically
Students should undertake a statistical analysis of the data that they selected. Their analysis should include:
- an understanding of the variables that they selected for analysis
- appropriate selection of graph or chart to suit the chosen variables
- conventions followed in graphing or representing the data
- calculations of measures of centre appropriate to the data and adding to the story of the data
- calculations of measures of spread appropriate to the data and adding to the story of the data
- an analysis of the calculations
- an analysis of the shape and distribution of the data.
At any stage students may choose to go back and change or re-work sections as they question the data.
Communicate the results
Students should use technology and present their data in different formats (tables, and graphs, perhaps within a spreadsheet).
Students are expected to draw conclusions from the results of their exploitation of the data. Conclusions should relate back to the context and add to the story of the famous race.
Unit 2 Area of Study 3: Discrete mathematics Financial and consumers mathematics
Examples of learning activities
- Choose a new car that you would like to buy, and compare the features, benefits and costs of three different insurance policies (including premium and excess). Which policy offers the best value for money? Why?
- Identify key features on bills at home, e.g. electricity, gas, phone, rates, car registration. Ask students to undertake calculations to check their understanding of the information presented on these bills. Present students with mock bills that include financial mistakes. Ask them to identify the problem and suggest a solution.
- Prepare an investigation into an industry that might be described as ‘predatory’ (good examples include payday lending and gambling). Compile and explain data and statistics that might convince the government to better regulate these industries.
- Investigate how you could pay for an item worth between \$5000 and \$10,000 – it may be a second-hand car, a musical instrument or a racing bike. Compare at least three different payment strategies (saving, buy now pay later, and traditional credit cards). What would be the total amount paid depending on the payment strategy used?
- Prepare a cost-benefit table that compares the costs associated with owning your own car vs a car subscription service.
- Investigate whether income (wages) is keeping up with changes in the cost of living (described as inflation) across different jobs / industries.
- Investigate a student loan scheme (i.e. HECS-HELP or a VET student loan). Explain the costs and benefits of the scheme. What strategies might help to repay the debt quickly? Calculate the impact of these strategies on the amount paid overall.
Detailed example
Are wages keeping up with the cost of living?
Identifying the context for the investigation
An issue for workers is whether their income (wages) can keep up with changes in the cost of living (described as inflation). Inflation is measured by the Consumer Price Index (CPI).
For example, if actual wages increased by 5%, but inflation was 5%, the purchasing power of your wages has stayed the same and you are unlikely to be able to improve your personal financial circumstances and standard of living.
Mathematical content covered
In this investigation and activity, the focus is on using and applying mathematical content taken from Area of Study 3: Discrete mathematics Financial and consumer mathematics, in particular, local, community and national financial and economic data and trends over time (national / community / local) such as CPI, interest rates, wages and house prices.
Key knowledge
- factors that impact on personal income and informed spending choices such as age, advertising, scams and gambling
- interest, repayments and relationship to amount borrowed, interest rates, time, CPI and risk
- financial systems and related calculations such as student loan schemes (HECS-HELP and VET student loans).
Key skills
- describe, calculate and interpret different income related taxes, payments and deductions and their impact on income, such as student loan repayments, allowances, benefits and payments.
This detailed example follows the same problem-solving cycle for undertaking an investigation:
- formulating the problem and planning what maths to use and how
- exploring and doing the maths required to solve the problem at hand
- communicating the results and outcomes of the investigation.
Formulate the question to be investigated
This investigation asks students to apply mathematics to read, interpret and analyse publicly available economic data. The investigation is structured in such a way as to support students to identify income inequality and develop an understanding how this might affect their and others’ financial perspectives and prospects.
Explore the problem mathematically
Ask students to visit the Australian Bureau of Statistics (ABS) to find out the CPI for the previous calendar year.
Real wages = actual wage growth - inflation
Next, ask them to examine the table of hypothetical wage growth data by industry (below).
What do students notice? Which industries may be more desirable and why?
Table 1. Annual increase in hourly rate of pay by industry
| Industry | Actual wage growth annual % |
|---|---|
| Mining | 1.8 |
| Manufacturing | 2.5 |
| Electricity, gas, water and waste services | 1.3 |
| Construction | 2.4 |
| Wholesale trade | 2.4 |
| Retail trade | 2.6 |
| Accommodation and food services | 3.5 |
| Transport, postal and warehousing | 1.8 |
| Information media and telecommunications | 2.2 |
| Financial and insurance services | 2.3 |
| Rental, hiring and real estate services | 2.5 |
| Professional, scientific and technical services | 2.5 |
| Administrative and support services | 2 |
| Public administration and safety | 2.3 |
| Education and training | 2.1 |
| Health care and social assistance | 2.4 |
| Arts and recreation services | 2 |
| Other services | 2.3 |
| All Industries | 2.3 |
This activity could be extended in the following ways:
- Ask students to graph quarterly and / or annual wage growth data compared with inflation data over time. Discuss the implications for workers in industries where wages are barely keeping up with inflation.
- Ask students to collect complementary data, such as average weekly earnings. What does this additional data reveal about the rewards and challenges associated with different careers?
- Ask students to investigate the proportion of females and males employed by industry. What does this additional data reveal about women’s financial opportunities and experiences compared with men’s?
- Present students with a media article reporting on a recent union negotiation for an industry-wide pay rise over several years. Ask students to apply what they have learned to determine whether the pay rise is a good deal (or not).
Communicate the results
Ask students to compile an infographic that presents their findings.
Useful search terms on the Australian Bureau of Statistics (ABS) website:
- Wage Price Index
- Consumer Price Index
- Labour Force
- Average Weekly Earnings
- Gender Indicators
Unit 2 Area of Study 4: Space and measurement
Examples of learning activities
- Examine building plans for a house or unit. Look at the scale on the plans and perform calculations for furnishing the house. Make a scale model from a simple plan such as a cubby house.
- Investigate bushfire maps and learn about the key features and symbols used to communicate crucial information via these maps.
- Visit a free public orienteering course at a state or national park such as Cardinia Reservoir. Use compasses and maps (see Parks Victoria) to undertake the orienteering activities. For example, use maps to plan a day of bike riding along one of Victoria’s many spectacular bike trails. Plan your route, stops and overnight stays. Include distances and times, and use a contour map to describe your itinerary and hike highlights.
- Create tessellations. Start with a square piece of paper which you cut shapes from and add these shapes to the outside edge of the square to make your template. Use this template to draw your tessellations. Discuss the properties of geometric tessellations.
- Visit Federation Square and identify and name all the geometric shapes that feature in the buildings within and around the square.
- Determine the most cost and time efficient route when travelling to a particular destination. Consider one domestic and one international destination.
- Interpret timetables such as bus, train, tide charts and moon phases for fishing or planting crops. For each, prepare a written statement giving examples how the information is useful to different people.
- Investigate and analyse the dimensions of the playing area and permitted variations for your favourite sport. Draw a scale plan of a playing field/area for the sport accompanied by a written description.
- Choose a site of cultural significance in Victoria that you would like to visit and plan a trip there. Explain why you chose this destination. Decide on how you would get there. Draw a map and describe the route, showing distances travelled and the time you estimate it would take, where and how long you would stop for, including any overnight stops, etc.
- Take a visit to a supermarket and browse the supermarket shelves. Take photos and make notes about some of the different shapes of solid (plastic / glass / cardboard) packages and containers for different products you can find. Identify at least 15 different shapes. Analyse what you found and classify and sort them according to different properties. For example, consider dimensions, number of sides and / or angles. You could create a table to document your classifications.
Detailed example
Taxi versus alternative transport
Mathematical content to be covered
Key knowledge
- language, symbols, labelling and conventions for maps and location related diagrams and directories, including keys, scale, direction, distance, coordinates and grid references.
Key skills
- interpret information on maps to plan and describe travel routes, including use of navigational software and tools.
Formulate the question to be investigated
This investigation asks students to consider whether it is cheaper to travel via taxi or an alternative transport company by analysing travel times, distances travelled and the cost of the journey. Which is the most cost-effective option?
Explore the problem mathematically
Taxis are part of the combination of modes of public transport around cities and suburbs. One method of getting around is using a taxi, and various charges and fees apply, depending on the circumstances of travel. Current fees and charges can be accessed from Taxi and Fares | Commercial Passenger Vehicles Victoria (cpv.vic.gov.au).
Taxi fares are calculated with respect to the time the trip took place, distance travelled (when travelling above 21 kilometres per hour and/or the time taken and when travelling below 21 kilometres per hour). The corresponding formulas are:
Using the distance travelled method
fare = distance (in kilometres) x rate per kilometre + flagfall fee
Using the time taken method
fare = time taken (per minute) x rate per minute + flagfall fee
Where the flagfall fee is the minimum charge for hiring a taxi. It is payable regardless of how far travelled or the time taken.
Part 1
- Patsy is using a taxi at 4pm on a Monday to travel from work to home, which is a distance of 15 kilometres. How much will this trip cost her in a car?
- Jimmy is taking a taxi to the city at 2am on a Saturday and the distance into the city is 22 kilometres. However, night traffic works have caused the traffic to be moving under 21 kilometres per hour so the driver is charging him for time rather than distance. The trip takes 2 hours. How much will these journeys cost him?
- Daisy has flown into Melbourne airport from Sydney for one day. She wants to make the most of her trip by visiting two zoos; Werribee Zoo and Healesville Sanctuary and decides to travel by taxi. The distance between the airport and Werribee is 43 kilometres. The distance between Werribee Zoo and Healesville sanctuary is 107 kilometres via city link (southern link). Healesville Sanctuary and back to Melbourne Airport 75 kilometres. How much will the trip cost if she is charged a daily rate?
Part 2
For each of the following scenarios use a maps tool to calculate distances and then use the relevant formula to calculate the corresponding taxi fare. When calculating the taxi fare relevant any tolls, fees and charges should be included. Assume speed hasn’t fallen below 21 kilometres per hour for any extended period of time, and the trip is in the daytime.
In each case, use a fare estimator, for example: Fares | Commercial Passenger Vehicles Victoria (cpv.vic.gov.au) to check your answers.
- Melbourne City Baths, Swanston Street to Fitzroy Gardens, Wellington Parade
- Southern Cross Station, Spencer Street to Northern Hospital, Cooper Street, Epping
- Mercy Hospital for Women, Studley Road, Heidelberg to Flinders Street Station, Flinders Street
- Eureka Skydeck 88, Riverside Quay to Frankston Reservoir, Frankston South
- Melbourne Park Hyatt to Werribee open range zoo. If payment is by credit card, how much more will this cost?
- Re-calculate each of the above taxi fares using the overnight rate.
- Construct a distance – time graph for one of these scenarios.
Part 3
- Re-calculate the fare for each of the above scenarios using the time rate instead of distance method.
- Which results in a cheaper ride?
- Why would a taxi driver calculate time taken rather than the distance travelled?
- Develop several scenarios related to the types of trips you and your friends might be likely to take and calculate the corresponding fare using an appropriate method.
- Construct a cost – time graph for one of these scenarios.
Over the past few years alternative transport companies that give passengers a convenient and innovative way to request and pay for rides on an app through their smartphones have become popular. The app automatically figures out the navigational route for the driver, calculates the distances and fares and transfers the payment to the driver.
Using the distance travelled method
fare = distance (in kilometres) x rate per kilometre + flagfall fee (Base fee + Booking fee)
Using the time taken method
fare = time taken (per minute) x rate per minute + flagfall fee (Base fee + Booking fee)
An example of alternative transport company charges:
- Flagfall: $2.50
- Booking fee: $0.55
- Minimum charge: $9.00
- Charge per minute: $0.40
- Charge per kilometre: $1.45
Recalculate Parts 1 to 3 using the Uber charges.
Communicate the results
What is your verdict? Does the Taxi or alternative offer the best option for transport?
Units 3 and 4
Units 3 and 4 Area of Study 1: Algebra, number and structure
Examples of learning activities
- Research the use of the Body Mass Index (BMI) graph and its formula for both metric and imperial units of measurement. Also research alternative measures of health and describe how they differ in how they are calculated compared with the BMI.
- Research formulas that can be used for calculating the medication dosage for children, as dosages for children are often not provided by the manufacturer because there can be large variations in children’s weight for the same age. There are several methods for calculating children’s dosage based on different characteristics. Find two formulas and write up a summary report showing the formula, comparing and explaining how they work, and giving examples of dosages for children of different ages / weights.
- Investigate the hiring rates for two different rental companies, and compare their rates, including for delivery and pickup and decide which one is cheapest and for how many hours or days of hire. For example, compare the costs of hiring a commercial-grade ride on lawn mower from these two different hire companies. Firm A charges \$190 per day plus a delivery and pick up fee of \$80 each way, whereas a second company, Firm B, charges \$240 per day but their delivery and pick up fee is a combined total of \$60. Investigate the differences between hiring from the two firms. Develop an algebraic formula for each firm. For each formula, transform the formulas to be able to calculate how many days you can hire the lawn mower for fixed amounts, such as \$500 or \$2000. Use technology to create a graphical representation of the two sets of costs and their formulas on the same graph for different numbers of days’ hire. Use the formulas and the graph to decide which firm you would use for different hiring periods. What does the intersection point on the graph represent and tell you?
- Research the use and application of ratios in mixing up concrete. Concrete is made by mixing cement, sand and aggregate. The other critical element in making successful and strong concrete mixes is the ratio of water to cement. Write up a report on how ratios are used in making different types of concrete and give examples of how this works for different circumstances.
- Investigate and explain the difference between direct and indirect variation using the mathematical relationship between average speed, distance and time. Write up a summary presentation or poster explaining the difference between direct and indirect variation, providing examples and graphs to support your explanation.
Detailed example
Children’s medicine dosages
Identifying the context for the investigation
The specific dosages for administering medications to children and babies are sometimes not provided in advance for doctors and nurses giving the medication. This is often because a child of the same age can vary greatly in their size (height and weight), and this information is not known in advance. There are different methods provided or available for doctors or pharmacists to calculate a child’s medicine dosage.
Mathematical content covered
In this investigation and activity, the focus is on using and applying mathematical content taken from Outcome 1, Area of Study 1: Algebra, number and structure with some knowledge required from Outcome 1, Area of Study 4: Space and measurement.
Outcome 1, Area of Study 1: Algebra, number and structure
Key knowledge
- conventions of formal mathematical terminology and notations in calculations, symbolic expressions and formulas
- algorithmic, algebraic and computational strategies
- number facts, operations and relationships for calculations
- ratios, proportions and percentages
- manipulation of formulas
- contextual and real-world meaning of numerical results.
Key skills
- use and apply the conventions of mathematical notations, terminology and representations
- make estimates and carry out relevant calculations using mental and by-hand methods
- use different technologies effectively for accurate, reliable and efficient calculations
- solve practical problems which require the use and application of a range of numerical and algebraic computations
- solve practical problems requiring graphical and algebraic processes and applications, including substitution into formulas
- evaluate the mathematics used and the outcomes obtained relative to personal, contextual and real-world implications.
This detailed example follows the same problem-solving cycle for undertaking an investigation:
- formulating the problem and planning what maths to use and how
- exploring and doing the maths required to solve the problem at hand
- communicating the results and outcomes of the investigation.
Formulate the question or problem to be investigated
While the main purpose is to investigate what can be found out about how doctors or pharmacists can calculate a child’s medicine dosage and to find some formulas for doing this, a possible starting point is to look at a common child medication. The teacher could access a copy of the instructions of, for example, Panadol for children.
This could be used for brainstorming how dosages are described for children of different ages. Initial questions to be posed to stimulate the discussion could include:
- How is the amount of medication prescribed?
- Is it a fixed amount by age?
- If not, what is it based on?
- Why do you think this is how it is prescribed?
- What maths knowledge do you need to know to be able to understand these instructions?
Once the idea that children’s dosages cannot be specified simply by age has been established, pose the question, ‘How might doctors and pharmacists work this out?’ The solution that seems to be prevalent is to work out the dosage based on a specified proportion of an adult’s dosage, and it can be based on three different aspects of the child:
- their age
- their weight
- their body surface area (BSA).
Once this is understood, students can then use the internet to research some key questions, such as:
- How are children’s dosages of a medicine calculated?
- Are there formulas available for calculating these dosages?
Relevant background information
Several different methods may be used to determine the correct dosage of medication for a child. Some methods that are used that might come up in researching the topic include:
- Fried's rule
- Young's rule
- Clark's rule
- Nomogram method
- Parkland's formula.
The most suitable ones for this investigation are probably Young’s rule and Clark’s rule. Remember that there will be both metric and imperial formulas. A focus on the metric versions is probably the most appropriate and relevant.
Accuracy and precision
Another critical aspect of child medication dosages is the accuracy or precision of the measurement of the dosages. This could be incorporated into the investigation. It seems that the following rounding rules are recommended:
Weight Doses (mg)
- When calculating doses in weights, medications that are less than 1 mg should be rounded to two decimal places.
- Doses that are 1mg to 10 mg should be rounded to one decimal place.
- Doses greater than 10 mg should be rounded to the whole number.
Volume Doses (mL)
- Doses that are less than 1 millilitre should be rounded to two decimal places.
- Doses greater than 1 millilitre should be rounded to one decimal place.
Explore the problem mathematically
The second stage is to undertake the mathematical aspects of the investigation. The teacher may well need to work with students to refine their questions and the approach to be followed.
For example, some more specific issues and questions to research and investigate could be:
- Find at least three formulas for calculating a child’s dosage of a medication – but choose two that are simpler formulas to investigate further and use in your project.
- Can you describe your two formulas in terms of the formal terminology of mathematics – that is, in terms of constants, pro-numerals, variables, etc.
- Can you describe your two formulas in terms of any direct or inverse variation between the variables?
- Can you compare your two different ways of calculating dosages? What are the differences?
- How do you decide how precise or accurate the measurement of the amount of medication should be?
- Use your two formulas to calculate different dosages for children of different ages, weights etc.
- Input your formulas into a spreadsheet for calculating the dosages based on the relevant input variables. They could create a graph of the dosages.
Negotiate with students how they might work through this logically and develop a process for formalising the calculations into a formula, perhaps using a spreadsheet.
Some hints or information that could help support and scaffold their investigations and work might include:
- Provide the ages and varied weights for five different children as the basis for their analysis and comparisons.
- Provide some amounts of adult dosages that could be used as the basis for the calculations and analysis.
- Pose specific questions to answer in relation to the sample of children. For example, which formula gives a particular child the smallest dose, or which children would have the same dosages according to Formula X, or which formula would recommend about double the dosage for child Y compared with child Z, etc.
Communicate the results of the problem
Students should write up and using the formal language and terminology of algebra, present the findings of their investigation into the formulas for calculating child dosages, document how they work and how they are different from each other, and document how they can be used to calculate dosages for different children.
They may choose to make a poster, write a report or create a multimedia presentation.
Units 3 and 4 Area of Study 2: Data analysis, probability and statistics
Examples of learning activities
- Research and compare three different types of cars: combustion petrol engine, hybrid (petrol and electric), and fully electric. Choose cars that have similar energy / power ratings. Consider aspects such as fuel efficiency, purchase cost, running costs and maintenance, insurance, etc. Write up a one- or two-page document that summarises the differences and includes at least two different graphical representations of what your research found.
- Medicine labels and instructions: Visit a supermarket or use the Internet to find the information through an online supermarket store to research about the different types and brands of available over-the-counter headache medicines (e.g. paracetamol, ibuprofen, aspirin). Compare and analyse the different medicines and brands in terms of their ingredients, recommended dosages, and their cost. Write a report describing your results.
- Research national (Australian) and local (Victoria and other states) statistics on weight and obesity. Draw on mathematics to make comparisons based on categories like location, age-group and gender. How do Australians’ measures compare with people living in other countries? Write up a report of the findings, including some graphs and summary statistics of the data.
- Prepare an ‘explainer’ to help a new parent read and interpret baby growth charts (weight and length). What are percentiles? What factors might reasonably influence a baby’s percentile measurements? Use numbers, words and graphs to communicate your findings.
- Undertake a survey of your school’s students and analyse how many participate in sport, what types of sport, and how often do they compete or participate? Compare the school data to available state or national data.
- Investigate and analyse the operation of a finals series for your favourite sport or competition, including the relative chances of winning from different ladder positions using data from previous final series.
- Investigate and analyse the use of chance and data in determining weather forecasts, especially in relation to predicted rainfall and maximum temperature.
Detailed example
Cleanest air in the world!
This example demonstrates how the three outcomes are taught together using content from Area of Study 2: Data analysis, probability and statistics. Outcomes provide the key knowledge and skills (Outcome 1), that are taught using a mathematical investigation (Outcome 2), and with the use of technology (Outcome 3).
Identifying the context for the investigation
Cape Grim is the website for CSIRO’s contribution to the Baseline Air Pollution Stations in the World Meteorological Organisation-Global Atmosphere Watch (WMO-GAW) network.
Cape Grim is located in a remote corner of north-western Tasmania. It is remote, rugged and windswept. These traits make it a desirable location for measuring atmospheric data to add to scientists' understanding of climate data.
Cape Grim measures greenhouse gases, including carbon dioxide (CO2), methane (CH4), nitrous oxide (N2O) and synthetic greenhouse gases such as hydrofluorocarbons (HFCs), perfluorocarbons (PFCs) and sulphur hexafluoride (SF6).
CSIRO provides data sets as CSV files on this website for download.
Mathematical content covered
Key knowledge
- categorical data and numerical data, including continuous data
- purposes for data collection and nature of audience for communication of results
- data collection and organisation, including the development and production of surveys
- the purposes and effectiveness of different forms of data representation and types of graphs and data scales, including contemporary digital representations
- features of sets of data such as measures of central tendency (mean, median and mode) and spread (such as standard deviation, quantile intervals, range and percentiles), shape of distribution and outliers
- likelihood and chance of events in relation to relative and long-term data and frequencies such as in relation to epidemics, the climate and the environment
- characteristics and properties of data sets, the shape of their distribution and representations and the terminology for comparison and analysis of data sets, graphs and summary statistics.
Key skills
- collect, organise, collate and represent categorical data and numerical data, including continuous data
- use technology effectively and appropriately for accurate, reliable and efficient collation and representation of data sets
- accurately read and interpret charts, tables and graphs including prediction, interpolation and extrapolation of data
- calculate summary statistical data using common measures of central tendency and spread, including standard deviation
- use statistical language to describe, compare and analyse data sets, in terms of centre, spread, relationship and sample size
- draw inferences and conclusions, and explain any limitations and implications of a statistical study
- identify and interpret any errors and misrepresentations in data sets
- use long-term data and relative frequencies in practical situations to make informed interpretations and decisions about the likelihood of events or outcomes with respect to financial data, epidemics, climate data or environmental data.
Formulate the question or problem to be investigated
The teacher should explain a statistical investigation cycle, including components specific to this investigation:
- Identifying data using context
- Selecting variables and subsets within the data
- Trying multiple displays to make sense of the data
- Re-categorising the data looking for patterns and trends
- Undertaking measures of centre
- Undertaking measures of spread
- Using technology to calculate standard deviation and understand its meaning in relation to the data
- Drawing inferences and conclusions from the data
- Making recommendations based on the conclusions drawn
- Making predictions using both extrapolation and interpolation
- Identifying sources of error in both the data collection, and analysis
Students should examine the website and understand why the data is being collected.
For this investigation it is recommended that students use a spreadsheet application such as Excel or Google Sheets.
Introduce students to the concept of parts per million (ppm). You want to undertake a side activity to introduce ppm.
Students should ask questions about:
- Does this data already exist, via a secondary source?
- Who is collecting the data?
- Who is analysing the data?
- Who is funding the data collection?
- What happens to the data once it has been analysed?
Students should then select one data set for analysis from Cape Grim.
Explore the problem mathematically
The data sets from CSIRO can mimic ‘big data’, so the teacher may choose to set parameters on the data. For example, you might ask each group of students a different date range to analyse – and then combine the data together later. Or provide spreadsheet techniques to the students so that the students understand how the program can handle large data sets.
- Ask students to examine the data set and make decisions on how they might interrogate the data. Lead the students to independently identify and explain that the independent variable is the year, and the dependent variable is the gas being measured.
- Students should try multiple ways to graph the data and should understand how to change parameters to visually include all data in the range.
- Students should manipulate settings to be able to identify any patterns and trends that emerge from the data. Students should take smaller subsections of the data to identify smaller trends such as seasonal trends as well as the overall trend.
- Calculations of measures of centre should be undertaken.
- Calculations of measures of spread should be undertaken.
- These data files contain standard deviation for each measurement. Students should develop and display an understanding of each standard deviation in relation to the measurement, and understand its implications in relation to the overall data.
- Looking at their analysis and graphical representations, students should draw inferences and conclusions from the data.
- Students should then make both general and specific recommendations based on their conclusions drawn from the graphs and analysis.
- Students, using their graphical displays, should make predictions using both extrapolation and interpolation.
- Teachers should lead students in a discussion to identify sources of error in both the data collection and analysis.
Communicate the results of the problem
Students should present the findings of their investigation into greenhouse gases. They may choose to make a social media post or a multimedia presentation.
The teacher may wish to lead a discussion on how others seek to misrepresent data and the methods they use to do this.
Units 3 and 4 Area of Study 3: Discrete mathematics Financial and consumers mathematics
Examples of learning activities
- Analyse how cars change in value. Why do some cars retain their value, while others depreciate? What economic and business conditions cause this to happen? Illustrate this graphically by comparing sales figures for a number of different cars over a five-year period.
- Would it be a good idea to use a credit card to pay for a second-hand car? Why / why not? Apply mathematics to developing a convincing answer to this question.
- Source a graph or chart depicting fluctuations in the value of a cryptocurrency over time (bitcoin, dogecoin and ethereum are good examples). Write a story making mathematical statements about the percentage increase and decrease at various time points.
- Analyse house prices in metropolitan and regional areas. What factors lead houses in some areas to grow in value more so than others? Illustrate your findings graphically by comparing sales figures for a number of different houses over a five-year period.
- Compile a comparison table that summarises the cost structure of different providers of similar financial products and services (i.e. internet or mobile phone providers).
- Compile a comparison table that summarises the cost structure of three small or short-term loan products (i.e. a payday loan vs buy now pay later vs a traditional credit card).
- Model the difference between fortnightly and monthly mortgage repayments in terms of total amount and time to repay.
- Use mathematics to present a ‘worst case scenario’ story about costs associated with a compound interest loan product, such as a credit card or car loan.
- Use mathematics to inform a cost-benefit analysis on an insurance product (i.e. pet, car or house insurance). Can you convince a friend of your argument to buy / not to buy this insurance product?
- You are interested in taking out health insurance as a single person once you leave home. Research different health insurance schemes and find out the government specifications regarding the different levels of insurance. Decide what types and levels of services you believe you will use, and then research different insurance companies that offer the best deal for you. List three of them. Which one would you choose and why? Are you surprised how much health insurance costs? Write up a report on your findings.
- Over recent centuries, technological advances in agriculture and health have led to increased birth rates and decreased death rates and the world’s population has grown considerably. Investigate two key questions: ‘How will the population continue to grow?’, and ‘What population level can the planet sustain?’ Find reliable sources for this data and information and collate and graph the data using appropriate technology. Analyse what you found when researching these two questions and write a report based on your data.
Detailed example
Can small change make a big difference?
Identifying the context for the investigation
A good understanding of algebra is required to understand home loan products and the costs (and benefits) associated with owning a home (as one example of an asset).
Simple variations to loan variables can mean a home loan is repaid sooner, and at lower cost.
Mathematical content covered
Key knowledge
- investment and borrowing services offered by financial institutions such as investments, loans and mortgages.
Key skills
- compare, contrast and undertake routine calculations for credit options for personal financial management such as personal borrowing (a car, holiday) or for housing.
Formulate the question or problem to be investigated
This investigation asks students to apply mathematics to test the following conjecture:
- It is a good idea to make fortnightly, rather than monthly repayments.
Investigate the problem mathematically
Ask students to find out the fixed and variable home loan interest rates being offered by their financial institution.
Next, they will prepare to develop a model based on particular assumptions, like a $500,000 principal + interest mortgage to be repaid over a 30-year period.
They might experiment with online mortgage calculators as a starting point. What happens when adjustments are made to the regularity of the repayments? This information can be used to compile a table or spreadsheet.
You might extend upon this activity by asking students to investigate the following scenarios:
- Repaying an extra $100 per month
- Credit unions offer better deals than traditional banks
- Switching from a variable to a fixed interest rate
Communicate the results of the investigation
Ask students to compile a spreadsheet that makes a compelling mathematical argument.
Units 3 and 4 Area of Study 4: Space and measurement
Examples of learning activities
- Choose a snack food or sweet that comes in a cardboard package shaped as a rectangular prism (e.g. BBQ shapes or chocolates like Smarties). Design and draw the plans to scale for new sized packaging that will either hold half / twice / three times as much of the product. Include precise measurements for the net of the packet.
- Fully design and cost a sustainability project, where you upcycle and price for sale a piece of second-hand clothing or furniture (i.e. redesign a formal dress, repaint a dining table, re-upholster an armchair).
- Design and cost a sewing project, such as costumes for the school production or a geometric patchwork quilt pattern. Calculate requirements that will achieve the least waste possible.
- Investigate the reasons behind why babies dehydrate faster than adults in summer. It's all to do with the relationship between length, surface area and volume. Think about different problem-solving strategies to help solve the problem – how can the problem be simplified? How can it be modelled? How can you analyse the data to make some conclusions?
- How many times do you think a piece of string would have to go round your head to be as long as your body? Guess first, then work it out. Try something similar with a can that holds 3 tennis balls. If you cut a piece of string so that it just fits around the widest part of a tennis ball, how would the length of the string compare to the height of the 3-ball can? Are you surprised? Investigate and report on the maths sitting behind this. Produce a poster that shows what you found out and what the maths is behind it all.
- In conjunction with staff at the school, arrange to visit a manufacturing business in your local area or region and investigate the range of measurements that are required as part of the items being produced. Document what measurements are taken, what units they are measured in, what tools are used to undertake the measurements. Are there plans and scale drawings that set out the measurements to be followed – ask for copies of any such documents. Do they need to use any formulas to calculate any measures, such as area and capacity? Ask about issues related to calibrating tools, and what errors in measurement are allowable (or not), including how they specify and check re tolerances, accuracy and precision. Produce a report and summary that sets out what you found.
- Select three different national or related flags (such as Australia’s Aboriginal flag or the Torres Strait Island flag) and analyse their shapes and proportions. Learn about the specific language used to describe flags (e.g. canton, hoist, fly etc.). Think about questions such as ‘Why can’t you describe the placement on flags using right and left?’. Draw a scale drawing of each of your flags and write a description of each one, specifying their characteristics including their proportion, component shapes and colours and their positioning and relative size, and state all aspects that are symmetrical.
Detailed example
Why do babies dehydrate faster than adults in summer?
This example demonstrates how the different outcomes and areas of study can be taught together using content from Area of Study 4: Space and measurement that is also supported by Area of Study 1: Algebra, number and structure. Outcomes provide the key knowledge and skills (Outcome 1), that are taught using a mathematical investigation (Outcome 2). This can be supported by the use of technology (Outcome 3) in developing the report on the research and investigation.
It poses a relatively complex, conceptual challenge for students to come to grips with, and the use of hands-on materials supports and enables this to happen.
Materials required:
- A set of interlocking centimetre cubes – enough for students to work in pairs or small groups using the cubes.
Mathematical content covered
In this investigation and activity, the focus is on the problem-solving process (Outcome 2) and on using and applying mathematical content taken from both Area of Study 1: Algebra, number and structure and Area of Study 4: Space and measurement in Outcome 1.
Outcome 2: Key knowledge
- uses and applications of mathematics and numerical data and information in aspects of contemporary life and the embedded nature of this mathematics in work, social and personal contexts
- relevant and appropriate mathematics in areas relating to student’s study, work, social or personal contexts
- common methods of presenting and communicating mathematics in everyday life, for example charts, graphs, maps, plans, tables, algebraic expressions and diagrams.
Outcome 2: Key skills
- identify and recognise how mathematics is used in everyday situations and contexts, making connections between mathematics and the real world
- extract the mathematics embedded in everyday situations and contexts and formulate what mathematics can be used to solve practical problems in both familiar and new contexts
- represent the mathematical information in a form that is personally useful as an aid to problem-solving, such as a table, summary, chart, numeric or algebraic representation, physical model or sketch
- undertake a range of mathematical tasks, applications and processes to solve practical problems, such as drawing, measuring, counting, estimating, calculating, generalising and modelling
- interpret results and outcomes of the application of mathematics in a context, including how appropriately and accurately they fit the situation, and to critically reflect on and evaluate the mathematics used and the outcomes obtained relative to personal, contextual and real-world implications
- represent, communicate and discuss the results and outcomes of the application of mathematics in a range of contexts.
Outcome 1, Area of Study 1: Algebra, number and structure
Key knowledge
- conventions of formal mathematical terminology and notations in calculations, symbolic expressions and formulas
- algorithmic, algebraic and computational strategies
- number facts, operations and relationships for calculations
- ratios, proportions and percentages
- manipulation of formulas
- estimations and approximations
- contextual and real-world meaning of numerical results.
Key skills
- use and apply the conventions of mathematical notations, terminology and representations
- make estimates and carry out relevant calculations using mental and by-hand methods
- use different technologies effectively for accurate, reliable and efficient calculations
- solve practical problems which require the use and application of a range of numerical and algebraic computations
- solve practical problems requiring graphical and algebraic processes and applications, including substitution into formulas
- use estimation and other approaches to check the outcomes, including for accuracy and reasonableness of results
- evaluate the mathematics used and the outcomes obtained relative to personal, contextual and real-world implications.
Outcome 1, Area of Study 4: Space and measurement
Key knowledge
- the names and properties of shapes and objects and their representations
- metric and other related quantity measures
- routine digital and analogue measurement tools and instruments and scales
- formulas for calculating length, area, surface area, volume and capacity
Key skills
- interpret and describe shapes and objects and their representations using geometric and spatial language and conventions
- calculate and interpret area, surface area, volume, capacity and density of routine, including compound, shapes
- use estimation, rounding and approximation strategies to check the outcomes and interpret the results and to reflect on the outcomes obtained relative to personal, contextual and real-world implications.
Identifying the context for the investigation
Every summer there are news reports about babies or young children being left in cars in the hot weather, with often dire consequences. In Australia, there can be in excess of 5000 reports of children needing to be rescued after being left unattended in a car.
Leaving children unattended in a car – even for a short period of time – can be fatal. Children are particularly at risk because they can lose fluid quickly, become dehydrated and suffer from heatstroke.
For information about this situation and the recommended actions, visit Kid Safe Victoria and look under the Safety Advice section for further information. The information provides advice about what parents or providers need to do to make sure this doesn’t happen.
Formulate the question or problem to be investigated
Why do babies dehydrate faster than adults in summer? What is the mathematics sitting behind this? How can you begin to investigate this issue? Brainstorm with students the factors that might be relevant. What are some differences between babies and adults? Include physical attributes. Why might this be relevant? Introduce the idea of dehydration being related to the amount of skin (surface area).
Think about possible problem-solving strategies that you could utilise, and propose and work through these questions:
How could you model the situation?
How could you take:
- a simpler case
- a simpler shape – after all, people are very complicated shapes
- and a simple size – say the adult is twice the scale of the baby.
Suggest the use of centimetre cubes and ask how you could create a simple model of an adult versus a baby using the cubes.
Explore the problem mathematically
Agree on how you might work through this logically and develop a process for investigating the relationship between length, surface area and volume for a baby versus an adult, represented by the cubes. The following notes give you a suggested approach to follow, using the blocks to model and research what happens as you model a doubling of size, then what happens if you treble the relative size of the adult model.
Doubling …
Use 3 small cubes to make a model of your baby.
- What is its volume?
- What is its surface area (skin), i.e. how many little squares would cover it?
Now make a model of an adult that is double in scale.
- What is its volume?
- What is its surface area (skin)?
Complete the table with the outcomes:
| Dehydration 1 | length | surface area | volume |
|---|---|---|---|
| original model ... baby | |||
| model doubled in scale ... adult |
Did the surface area and volume increase by the same amount, or did one increase more than the other?
- How many square units of skin for each cubic unit of volume allow water to be lost:
- by the baby?
- by the adult?
- so, which would lose water faster?
But why?
And is an adult only double the size of a baby? Should we model a bigger sized adult?
So, we have the beginning of an answer, but let's try to go a bit further to understand what's happening. Fill in the table below, by continuing to double the scale.
Can you see a pattern that lets you work out the last row or two without having to actually build the model?
| Dehydration 2 | length | surface area | volume |
|---|---|---|---|
| original model ... baby | |||
| model doubled in scale ... adult | |||
| model doubled in scale again ... | |||
| and again ... | |||
| and again ... |
Why does the area go up by a factor of 4? and the volume by a factor of 8?
Look at the 2 models
Each single unit of skin in the little one:
- is replaced by 4 units of skin in the larger one,
- i.e. a 1x1 square is replaced by a 2x2 square.
Each single unit of volume in the little one:
- is replaced by 8 units of volume in the larger one,
- i.e. a 1x1x1 cube is replaced by a 2x2x2 cube.
Discussion and extension
But would this be true for shapes other than our simple one?
Take a slightly more complex shape and investigate.
What happens when we double this shape in scale? Try it ...
But what if it's not just doubling?
We have begun to see what's happening when simple things are doubled in scale … but, an adult probably isn't simply double the scale of a baby – we just assumed that at the beginning to make life easier.
Can we predict what will happen if the adult is 3 or 10 or 100 times the scale of the baby?
Use the blocks to treble the model.
Then try to use the pattern to fill in the rest of the table.
| Dehydration 3 | length | surface area | volume | surface area ÷ volume |
|---|---|---|---|---|
| original model ... baby | ||||
| model doubled in scale ... adult | ||||
| model doubled tripled in scale | ||||
| model x 10 | ||||
| model x 10 |
The last column gives a measure of how many units of available skin are able to lose water compared to each unit of volume.
So, what does this mean about dehydration when the scaling factor is 3?
Again, look at the two models.
Each single unit of skin in the little one:
- is replaced by 9 units of skin in the larger one,
- i.e. a 1x1 square is replaced by a 3x3 square.
Each single unit of volume in the little one:
- is replaced by 27 units of volume in the larger one,
- i.e. a 1x1x1 cube is replaced by a 3x3x3 cube.
So, as we treble, which is growing faster, the skin or the volume?
Which then, of these people, would dehydrate fastest?
Formalising our findings and refining the model
Can we connect this with what we know about calculating surface area and volume for such shapes? Can we use the formulas for calculating surface area and volume of the above shapes (rectangular prisms) to analyse the above question, now we have established connections between surface area and volume for the study of our question about babies dehydrating?
An approach to this could be:
- What is a better sized rectangular prism for approximating the size of a baby or toddler? Take an age and find out about some possible dimensions to use. Maybe someone in the group has a younger brother or sister they can use as a model?
- What size prism will you use for the adult? Or a teenager?
- Once you agree on a more realistic size for your rectangular prism representations of a baby/toddler and adult/teenager, complete the above analysis using your formulas for comparing their relative surface areas and volume.
- How does this compare with the original analysis using the centimetre cubes?
Or use any other model and the formulas to investigate this question mathematically.
Communicate the results of the problem
So, let’s return to the original question: Why do babies dehydrate faster than adults in summer?
Students should present the findings of their investigation with reference to the original question. They may choose to make a poster that explains why, write a report, or create a multimedia presentation. To support Outcome 3, students should use technology to develop their report and create visualisations of the project and models used.
Maybe students could consider addressing the following questions:
- What would the situation be with regard to cooling, rather than heating? Who would cool the most slowly?
- What factors or issues could also be dependent on this relationship between length, surface area and volume for different objects or items? Buildings, packaging, for example?