Assessment
Accreditation period Units 1-4 from 2023
General assessment advice
Advice on matters related to the administration of Victorian Certificate of Education (VCE) assessment is published annually in the VCE Administrative Handbook.
Updates to matters related to the administration of VCE assessment are published in the VCAA Bulletin.
Teachers must refer to these publications for current advice.
The principles underpinning all VCE assessment practices are explained in VCE assessment principles.
The glossary of command terms provides a list of terms commonly used across the Victorian Curriculum F–10, VCE study designs and VCE examinations and to help students better understand the requirements of command terms in the context of their discipline.
VCE General Mathematics examination specifications, sample examination papers and corresponding examination reports can be accessed from the VCE General Mathematics examination webpage.
Graded distributions for graded assessment can be accessed from the VCAA Senior Secondary Certificate Statistical Information webpage.
Excepting third-party elements, schools may use this resource in accordance with the VCAA's educational allowance (VCAA Copyright and Intellectual Property Policy).
Scope of tasks
For Units 1–4 in all VCE studies, assessment tasks must be a part of the regular teaching and learning program and must not unduly add to the workload associated with that program. They must be completed mainly in class and within a limited timeframe.
Points to consider in developing an assessment task:
- List the relevant content from the areas of study and the relevant key knowledge and key skills for the outcomes.
- Develop the assessment task according to the specifications in the study design. It is possible for students in the same class to undertake different tasks, or variations of components for a task; however, teachers must ensure that the tasks or variations are comparable in scope and demand.
- Identify the qualities and characteristics that you are looking for in a student response and map these to the criteria, descriptors, rubrics or marking schemes being used to assess level of achievement.
- Identify the nature and sequence of teaching and learning activities to cover the relevant content, and key knowledge and key skills outlined in the study design, and to provide for different learning styles.
- Decide the most appropriate time to set the task. This decision is the result of several considerations including:
- the estimated time it will take to cover the relevant content from the areas of study and the relevant key knowledge and key skills for the outcomes
- the possible need to provide preparatory activities or tasks
- the likely length of time required for students to complete the task
- when tasks are being conducted in other studies and the workload implications for students.
Units 1 and 2
The students' level of achievement in Units 1 and 2 is a matter for school decision. Assessments of levels of achievement for these units will not be reported to the VCAA. Schools may choose to report levels of achievement using grades, descriptive statements or other indicators.
In each VCE study at Units 1 and 2, teachers determine the assessment tasks to be used for each outcome in accordance with the study design.
Teachers should select a variety of assessment tasks for their program to reflect the content and key knowledge and key skills being assessed and to provide for different learning styles. Tasks do not have to be lengthy to make a decision about student demonstration of achievement of an outcome.
A number of options are provided to encourage use of a range of assessment activities. Teachers can exercise flexibility when devising assessment tasks at this level, within the parameters of the study design.
Note that more than one assessment task can be used to assess satisfactory completion of each outcome in the units, and that an assessment task can typically be used to assess more than one outcome.
There is no requirement to teach the areas of study in the order in which they appear in the units in the study design. In mathematics an activity or task will often draw on content from one or more areas of study in natural combination, and involve key knowledge and skills form all three outcomes for the study.
Unit 1 sample assessment tasks
Sample context for assessment: Data investigation
Sample context for assessment: Data investigation
Introduction
The task involves the investigation of numerical data across categories.
Formulation
Overview of the context or scenario, and related background, including historical or contemporary background as applicable, and the mathematisation of questions, conjectures, hypotheses, issues or problems of interest.
In this task, formulation is related to finding the summary statistics and preparing boxplots for various data sets.
Exploration
Investigation and analysis of the context or scenario with respect to the questions of interest, conjectures or hypotheses, using mathematical concepts, skills and processes, including the use of technology and application of computational thinking.
In this task, exploration is related to the comparison of two or more categories over time.
Communication
Summary, presentation and interpretation of the findings from the mathematical investigation and related applications.
In this task, communication is related to the summary of results for the data and boxplots involved, and discussion of the results comparing two or more categories over time.
Part 1
Consider the data set {6, 9, 4, 6, 7, 1, 6, 1, 4, 0, 8, 0, 1, 8, 8, 2, 8, 6, 2, 8}
- Find the mean, median and mode of this data set and show that:
mean - Represent the distribution of the data using a dot plot and a box and whisker plot, and comment on the shape of the distribution.
Part 2
In the following data, sets of 20 elements are to be selected with repetition from the set of digits {0, 1, 2, 3, 4, 5, 6, 7, 8, 9} so that in each case a distribution is obtained which satisfies the given relation. In each case represent the distribution of the data using a dot plot and a box and whisker plot, and comment on the shape of the distribution.
- mean
- mode
- mode
- median
- median
Summarise how the relationship between mean, median and mode might be used to characterise symmetry or skewness in the distribution of some data.
Part 3
Investigate and prepare a brief data analysis report for a context using boxplots to compare numerical data for two or more categories over time.
Areas of study
The following content from the areas of study is addressed through this learning activity.
| Area of study | Topic | Content dot point |
| Statistics | Investigating and comparing data distributions | 1, 3, 4, 5, 6 |
Outcomes
The following outcomes, key knowledge and key skills are addressed through this task.
| Outcome | Key knowledge dot point | Key skill dot point |
| 1 | 1, 2, 3 | 1, 2, 3 |
| 2 | 1, 2, 3 | 1, 2, 4 |
| 3 | 2, 3, 5 | 2, 3, 4, 5, 8, 10 |
Sample context for assessment: Sequences and recurrence relations
Sample context for assessment: Sequences and recurrence relations
Introduction
The task involves the investigation of arithmetic and geometric sequences, first order linear recurrence relations and financial mathematics.
Formulation
Overview of the context or scenario, and related background, including historical or contemporary background as applicable, and the mathematisation of questions, conjectures, hypotheses, issues, or problems of interest.
In this task, formulation is related to investigating first-order linear recurrence relations and the types of sequences that their values can generate.
Exploration
Investigation and analysis of the context or scenario with respect to the questions of interest, conjectures or hypotheses, using mathematical concepts, skills and processes, including the use of technology and application of computational thinking.
Communication
Summary, presentation and interpretation of the findings from the mathematical investigation and related applications.
In this task, communication is related to the summary of results for the recurrence relations investigated.
Part 1
Consider a recurrence relation of the form $\large {u_0 = a, u_{n+1} = u_n + d}$ where $\large{a}$ and $\large{a}$ are constants.
Write down the first six terms of the sequence generated when $\large {a = 2}$ and $\large {d = 3}$.
Draw a graph of the values generated and describe the behaviour of the sequence.
Write down the first six terms of the sequence generated when $\large {a = 12}$ and $\large {d = -2}$.
Draw a graph of the values generated and describe the behaviour of the sequence.
Choose appropriate values of $\large {a}$ and $\large {d}$ to model:
- A simple interest loan.
- A simple interest investment.
- The depreciating value of an asset using the unit cost method.
- The depreciating value of an asset using the flat rate method.
Write a description of a possible practical context in each case.
Part 2
Consider a recurrence relation of the form $\large {u_0 = a, u_{n+1} = Ru_n}$ where $\large {a}$ and $\large {R}$ are constants.
Write down the first six terms of the sequence generated when $\large {a = 1}$ and $\large {R = 2}$.
Draw a graph of the values generated and describe the behaviour of the sequence.
Write down the first six terms of the sequence generated when $\large {a = 64}$ and $\large {R = \frac{1}{2}}$.
Draw a graph of the values generated and describe the behaviour of the sequence.
Choose appropriate values of $\large {a}$ and $\large {R}$ to model:
- A compound interest loan.
- A compound interest investment.
- The depreciating value of an asset using the reducing balance method.
Write a description of a possible practical context in each case.
Part 3
Investigate and prepare a brief report for a context comparing purchase options including cash, credit and debit cards, personal loans, buy now and pay later schemes.
Areas of study
The following content from the areas of study is addressed through this learning activity.
| Area of study | Topic | Content dot point |
| Algebra | Arithmetic and geometric sequences | 1, 2, 3, 4, 5, 6, 11 |
Outcomes
The following outcomes, key knowledge and key skills are addressed through this task.
| Outcome | Key knowledge dot point | Key skill dot point |
| 1 | 1, 2, 4, 5 | 1, 2, 3 |
| 2 | 1, 2, 3 | 1, 2, 3, 4 |
| 3 | 1, 4, 5 | 1, 3, 5, 12 |
Unit 2
There are three components to mathematical investigation:
Formulation
Overview of the context or scenario, and related background, including historical or contemporary background as applicable, and the mathematisation of questions, conjectures, hypotheses, issues or problems of interest.
Exploration
Investigation and analysis of the context or scenario with respect to the questions of interest, conjectures or hypotheses, using mathematical concepts, skills and processes, including the use of technology and application of computational thinking.
Communication
Summary, presentation and interpretation of the findings from the mathematical investigation and related applications.
Unit 2 sample assessment tasks
Sample Mathematical Investigation: globalisation, education and wealth
Sample Mathematical Investigation: globalisation, education and wealth
Formulation
The task uses data linked to globalisation and the wealth of countries compared with their educational level. Suitable data sets can be extracted from sites like Our world in data: It focuses on the investigation of whether a relationship exists between literacy rate and wealth and OECD membership.
Exploration
Part 1
Locate and select a random sample of data from 50 countries associated with the variables of literacy rate, GDP and OECD status.
- Construct a scatterplot showing literacy rates and GDP for the 50 countries.
- Describe the association between the two variables linked to direction, form and strength.
- Include a 'line of good fit' by eye and find its equation.
- Describe the features of the 'line of good fit' in terms of the context of the investigation.
- Use variation techniques to transform the GDP data and reconstruct the scatterplot.
- Include a 'line of good fit' and construct its equation.
Part 2
Separate the random selection of data into OECD and non-OECD countries.
- Construct separate scatterplots for the OECD and non-OECD countries showing the literacy rates against GDP. Include a 'line of good fit' by eye for each scatterplot.
- Discuss the features of each line and describe any differences or similarities linked to the context of the investigation.
- Redraw the scatterplots to show the relationship between literacy rates and the transformed set of data that best linearises the scatterplot information.
Communication
Analyse and discuss any findings, justifying any conclusions that are drawn and present your information in a structured report.
Areas of study
The following content from the areas of study is addressed through this learning activity.
| Areas of study | Topics | Content dot point |
| Data analysis, probability and statistics | Investigation relationships between two numerical variables | 1, 2, 4, 5 |
| Functions, relations and graphs | Variation | 2, 3 |
Outcomes
The following outcomes, key knowledge and key skills are addressed through this task.
| Outcome | Key knowledge dot point | Key skill dot point |
| 1 (AOS: Data analysis, probability and statistics) | 1, 2, 4 | 1, 2, 3, 4 |
| 1 (AOS: Functions, relations and graphs) | 2, 3 | 2, 3 |
| 2 | 1, 2, 3, 4 | 1, 2, 3, 4 |
| 3 | 1, 2, 3, 4, 5 | 1, 2, 3, 4, 5, 6, 7, 8, 9, 10, 11, 12 |
Sample Mathematical investigation: Tent size and guy rope length
Sample Mathematical investigation: Tent size and guy rope length
Formulation
The task involves the use of measurement and trigonometry in investigating the relationship between length, angle, perimeter and area of different sized standard triangular tents and a guy rope running from the top of the tent to the ground.
Exploration
Part 1
The profile of the front of a tent, ACD is in the shape of an equilateral triangle.
The base of the tent is on the ground and at the same horizontal level as points C and B. A guy rope attached to the tent at point A is also attached to the ground at point B.
Initially the side length of the tent and the distance between points B and C are equal at 2 metres.
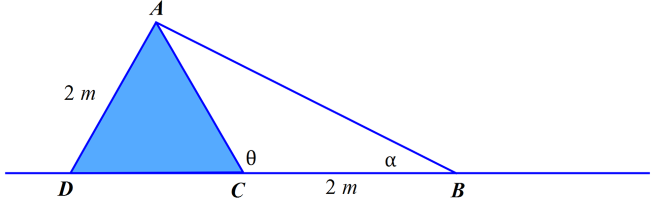
- Find the perimeter of the front of the tent.
- Find the size of the angle θ in degrees.
- Find the area of the front of the tent.
- Find the size of the angle a in degrees
- Find the length of the guy rope, AB.
Part 2
- If the side length of the tent and the distance between points B and C increased to 3 metres, investigate the changes that would occur in the perimeter and area of the tent front and the angles of θ and a.
- Choose two other lengths to represent the side length of the tent and the distance between points B and C. Recalculate all the values and angles found previously.
- Discuss any patterns or relationships found between the different lengths investigated and the calculated values of perimeter, area and angles of θ and a. Justify any findings.
Part 3
- Investigate the change in calculations if the front of the tent is changed to an isosceles triangle and the distance between points B and C is independent of the side length of the tent.
Communication
Summarise the findings, including specific examples, showing the relationships and patterns found in the lengths, areas and angles of the side length of the tent and the guy rope length.
Present the findings in a well-organised report.
Areas of study
The following content from the areas of study is addressed through this learning activity.
| Area of study | Topic | Content dot point |
| Space and measurement | Shape, measurement and applications of trigonometry | 1, 2, 3, 4, 7, 8 |
Outcomes
The following outcomes, key knowledge and key skills are addressed through this task.
| Outcome | Key knowledge dot point | Key skill dot point |
| 1 | 1, 2, 3, 4, 5, 7, 8 | 2, 3, 5, 6, 7 |
| 2 | 1, 2, 3, 4 | 1, 2, 3, 4 |
| 3 | 1, 2, 3, 5 | 1, 2, 3, 4, 5, 6, 8, 9, 10, 11, 12 |
Units 3 and 4
In VCE General Mathematics Units 3 and 4, the student's level of achievement will be determined by School-assessed Coursework and two end-of-year examinations. The VCAA will report the student's level of performance as a grade from A+ to E or UG (ungraded) for each of three Graded Assessment components: Unit 3 School-assessed Coursework, Unit 4 School-assessed Coursework and the end-of-year examination.
In Units 3 and 4, school-based assessment provides the VCAA with two judgments:
S (satisfactory) or N (not satisfactory) for each outcome and for the unit; and levels of achievement determined through the specified assessment tasks in relation to all three outcomes for the study. School-assessed Coursework provides teachers with the opportunity to:
- use the designated tasks in the study design
- develop and administer their own assessment program for their students
- monitor the progress and work of their students
- provide important feedback to the student
- gather information about the teaching program.
Teachers should design an assessment task that is representative of the content from the areas of study as applicable, addresses the outcomes and the key knowledge and key skills in accordance with the weightings provided in the study design, and allows students the opportunity to demonstrate the highest level of performance. It is important that students know what is expected of them in an assessment task. This means providing students with advice about relevant content from the areas of study, and the key knowledge and key skills to be assessed in relation to the outcomes. Students should know in advance how and when they are going to be assessed and the conditions under which they will be assessed.
Assessment tasks should be part of the teaching and learning program. For each assessment task students should be provided with the:
- type of assessment task as listed in the study design and approximate date for completion
- time allowed for the task
- nature of the assessment used to measure the level of student achievement
- nature of any materials they can utilise when completing the task
- information about the relationship between the task and learning activities, as appropriate.
Following an assessment task:
- teachers can use the performance of their students to evaluate the teaching and learning program
- a topic may need to be carefully revised prior to the end of the unit to ensure students fully understand content from the areas of study and key knowledge and key skills for the outcomes
- feedback provides students with important advice about which aspect or aspects of the key knowledge they need to learn and in which key skills they need more practice.
Unit 3 sample assessment tasks
Area of Study 1 sample application task: Data analysis
Area of Study 1 sample application task: Data analysis
Agricultural commodities
The application task is to be of 4–6 hours' duration over a period of 1–2 weeks.
Introduction
The agricultural commodities sector is very important for the economy of developing countries around the world. Data describing Australian agriculture and the agriculture for other countries around the world will be used to investigate local and international commodities. In this task the commodity of wheat will be investigated locally, nationally and internationally.
For comparison purposes, some currencies may need to be converted. See a list of exchange rates.
Component 1
Choose an Australian state or territory and randomly select a consecutive 10-year period for 'wheat produced'.
- Using an appropriate visual display and a set of summary values, analyse this set of data.
- Randomly choose another state or territory and data for the same consecutive 10-year period. Compare the information seen in this set of data with that found for the initially chosen state. Discuss any findings.
- For the initially chosen state, collect data for the variable 'wheat sold'. Create an appropriate data set using 'wheat produced' and 'wheat sold'. Summarise this data and discuss any findings.
Component 2
Select 'wheat production' for Australia for a consecutive period of 30 years.
Present the data in an appropriate time series display. Apply at least two smoothing techniques, discussing reasons for the choices, and comment on any findings.
- Fit a trend line to the data. Use the trend line to predict and forecast appropriately chosen examples. Discuss any findings.
- Examine the data for the appropriateness of fitting a transformed regression. Include two specific examples and discuss any findings.
- Select a second sample of 30 consecutive years and compare to the original set. Include any differences, similarities and findings linked to predictions and forecasting.
Component 3
Choose two other countries to compare with the findings discussed for Australia.
- Undertake a statistical analysis of each country's data. Include both visual and numerical summaries, including time series plots, and discuss the appropriateness of smoothing and transformations.
- Use predictions and forecasting to discuss production estimates for 2030 for each of the chosen countries. Estimate the impact of these predictions on the economy of each country.
Areas of study
The following content from the areas of study is addressed through this task.
| Area of study | Topics | Content dot point |
| Data analysis, probability and statistics | Investigating data distributions
Investigating associations between two variables
Investigating and modelling linear associations
Investigating and modelling time series data | 3, 4, 5
3, 4, 5, 6
1, 2, 3, 4, 5, 6, 7, 8, 9, 10
1, 2, 3, 5 |
Outcomes
The following outcomes, key knowledge and key skills are addressed through this task.
| Outcome | Key knowledge dot point | Key skill dot point |
| 1 | 1, 4, 7, 8, 9, 10, 11, 12, 13 | 3, 4, 7, 8, 9, 10, 11, 12, 13, 15, 17 |
| 2 | 1, 2, 3, 4 | 1, 4 |
| 3 | 1, 3, 4, 5, 6 | 1, 3, 4, 5, 6, 7, 9, 10, 11, 12 |
Area of Study 1 sample application task: Data analysis
Area of Study 1 sample application task: Data analysis
Exchange rates
The application task is to be of 4–6 hours' duration over a period of one to two weeks.
Introduction
Exchange rates are an important financial and economic measure, and are relevant for business activity and personal travel between countries, such as on a holiday. Exchange rate calculators are commonly used for day-to-day conversions.
The following investigation looks at how exchange rates between the Australian dollar and several other currencies of interest have varied over time, and the process of establishing suitable mathematical models for some of the corresponding exchange rates trends.

As part of this task, several data sets of historical exchange rates for countries of interest should be obtained, for example: RBA Exchange rates and RBA statistics.
Component 1
Select a currency for consideration, for example Hong Kong dollar, Euro, Pound, US dollar, Dirham, Yen or Renminbi.
- Choose several consecutive years of exchange rate data with a randomly selected starting point, for example a particular month in a given year.
- Using appropriate univariate analysis techniques, summarise and describe the distribution of the exchange rate in your sample.
- For your selected period, plot the exchange rate against time and discuss the relationship shown.
Component 2
Select a different currency for consideration and carry out analysis to construct a linear regression model.
- Draw a scatterplot of the data, determine the equation of the regression line, interpret the summary regression statistics in context, and draw the regression line on the scatterplot.
- Carry out a residual analysis, including a residual plot, based on your regression line and comment whether the linear model is suitable. Based on your analysis of residuals and the scatterplot, apply transformations to either of the variables (either exchange rate or time). Use residual plots and the coefficient of determination to determine a suitable model for this exchange rate.
- Use your preferred model to predict the exchange rate both one month and one year beyond your sample. Compare the predictions with the real data, using percentage error to determine the accuracy of your predictions.
Component 3
Select several different currencies, and state the current exchange rate for each of these.
- Construct models for the corresponding exchange rates relative to the Australian dollar, over the same period of time of several years, and draw the corresponding scatterplots and regression functions on the same set of axes.
- Comment on any similarities and differences in the exchange rate trend graphs.
Areas of study
The following content from the areas of study is addressed through this task.
| Area of study | Topics | Content dot point |
Data analysis, probability and statistics Investigating data distributions
| Investigating associations between two variables
Investigating and modelling linear associations
Investigating and modelling time series data | 2, 3, 4, 5
1, 4, 5, 6, 7
1, 2, 3, 4, 5, 6, 7, 8, 9, 10 |
Outcomes
The following outcomes, key knowledge and key skills are addressed through this task.
| Outcome | Key knowledge dot point | Key skill dot point |
| 1 | 1, 2, 3, 4, 7, 8, 9, 10, 11, 12 | 3, 4, 8, 9, 10, 11, 12, 13, 14, 17 |
| 2 | 1, 2, 3, 4 | 1, 4 |
| 3 | 1, 3, 4, 5, 7 | 1, 3, 4, 5, 6, 7, 8, 9, 10, 11, 12 |
Area of Study 1 sample application task: Data analysis – Live long and prosper?
Area of Study 1 sample application task: Data analysis – Live long and prosper?
The application task is to be of 4–6 hours' duration over a period of one to two weeks.
Introduction
Gapminder is an independent foundation based in Sweden that makes available a large amount of publicly funded data collected by governments and non-governmental organisations from around the world. This data can be accessed at Gapminder and downloaded.
In this task we consider life expectancy for people living in countries around the world, and how life expectancy is related to economic conditions in those countries. These relationships can be explored within the Gapminder website itself through the Gapminder World tab on the site; alternatively, the data can be explored by downloading it and using suitable technology.
The data sets considered in this task are Life Expectancy (Years) and Income per person (GDP per capita) for the set of 260 countries, for which data may have been recorded over the years 1800 to 2016 (note that gaps in the spreadsheet reflect instances for which no data was available for the respective country and year combinations). The data set recording total population (Population, total) of each country over the years 1800 to 2015 may also be useful. To download these data sets, search for the terms 'life expectancy', 'income' and 'population' using the search box within the Data tab on the Gapminder website.
Component 1
Compare the distribution of life expectancies in 1900 with those in 2015 for countries for which relevant data for these years is available.
- Construct a suitable display to compare the average life expectancies for these countries in 1900 and 2015.
- Compare the distributions of life expectancies for these countries in terms of shape, centre, spread and outliers.
- It is suggested that a 'world life expectancy' for 2015 can be calculated by averaging the life expectancies for each of the countries for which an average life expectancy figure is available. Is this suggestion reasonable? Explain how the calculation could be adjusted to refine this estimate of life expectancy.
Component 2
- Consider Japan and the United States. For each of these countries construct a time series plot of the life expectancies from 1900 to 2015 on the same axes.
- Describe the two time series plots, noting any similarities or differences in the trends between the two countries. Comment on any unusual features of the two-time series.
Component 3
In this component the relationship between how long a person lives and how wealthy they are is explored – do we 'live long and prosper'?
Consider all countries for which data has been collected for the year 2000.
- Construct a scatterplot of the life expectancies in 2000 against the income per capita in that year, and describe it in terms of direction, form and strength. Find the equation of the regression line for this scatterplot. Discuss whether this linear model is appropriate or not.
- Apply a suitable data transformation and construct the corresponding scatterplot. Describe this relationship in terms of direction, form and strength. Discuss which of the two scatterplots is most useful for predicting longevity based on income.
- For the relationship in b. above, find the equation of the regression line, draw the regression line on the scatterplot, and interpret the intercept and slope in terms of the how income related to life expectancy in 2000.
- Use this model to predict the life expectancy in 2000 based on the income per capita reported for a randomly selected country. Compare the prediction from your model with the actual recorded life expectancy for that country, using percentage error to determine the accuracy of your prediction.
- For both models find the correlation coefficient and the coefficient of determination between the life expectancy and the respective income variables in each case, and interpret these statistics. Explain whether the coefficient of determination is a reasonable measure of the strength of the relationship between life expectancy and the respective income-related variables for each of the cases described in a. and b. above.
Areas of study
The following content from the areas of study is addressed through this task.
| Area of study | Topics | Content dot point |
Data analysis, probability and statistics
| Investigating data distributions
Investigating associations between two variables
Investigating and modelling linear associations
Investigating and modelling time series data | 3, 4, 5
1, 3, 4, 5, 6
1, 2, 3, 4, 5, 6, 7, 8
1 |
Outcomes
The following outcomes, key knowledge and key skills are addressed through this task.
| Outcome | Key knowledge dot point | Key skill dot point |
| 1 | 1, 2, 4, 7, 8, 9, 10, 11, 13 | 2, 3, 7, 8, 9, 10, 11, 12, 13, 14, 18 |
| 2 | 1, 2, 3, 4 | 1, 4 |
| 3 | 1, 3, 4, 5, 6 | 1, 3, 4, 5, 6, 7, 9, 10, 11, 12 |
Area of Study 1 sample application task: Data analysis – Measles immunisation rates
Area of Study 1 sample application task: Data analysis – Measles immunisation rates
The application task is to be of 4–6 hours' duration over a period of one to two weeks.
Introduction
Immunisation is a key aspect of public health policy for the control of disease around the world.
In particular, data on immunisation rates is an important part of analysis. In this task we investigate the percentage of children aged 12–23 months immunised against the disease of measles in various countries. Relevant data can be found at Databank.
Component 1
Compare the distribution of immunisation rates in 1990 with those in 2015 for a group of countries.
- Randomly select 30 countries from the dataset.
- Construct an appropriate display to compare the immunisation rates for these countries in 1990 and 2015.
- Compare the distribution of immunisation rates for these countries in terms of shape, centre, spread and outliers.
Component 2
- Select two countries of interest and construct time series plots of the immunisation rates from 2007 to 2015 for each on the same axes.
- Describe the two time series plots, noting any similarities or differences in the trends between the two countries.
Component 3
Based on the 30 countries selected:
- Construct a scatterplot of the immunisation rates in 2010 against the immunisation rates in 1990, and describe it in terms of direction, form and strength.
- Determine the equation of the regression line, draw the regression line on the scatterplot, and interpret the intercept and slope in terms of the immunisation rates in 1990 and 2010.
- Use your model to predict the immunisation rate in 2015 for each of the countries. Compare the predictions with the real data, using percentage error to determine the accuracy of your predictions.
- Construct a scatterplot of the immunisation rate in 2015 against GDP per capita in 2015 (a measure of the wealth of that country). GDP data
- Determine the correlation coefficient and hence the coefficient of determination between the immunisation rates and GDP in 2015 and interpret these statistics.
Areas of study
The following content from the areas of study is addressed through this task.
| Area of study | Topics | Content dot point |
Data analysis, probability and statistics
| Investigating data distributions
Investigating associations between two variables
Investigating and modelling linear associations
Investigating and modelling time series data | 3, 4, 5, 6
1, 3, 4, 5, 6
1, 2, 3, 4, 5, 6, 7, 8
1 |
Outcomes
The following outcomes, key knowledge and key skills are addressed through this task.
| Outcome | Key knowledge dot point | Key skill dot point |
| 1 | 1, 2, 4, 7, 8, 9, 10, 11, 12 | 2, 3, 7, 8, 9, 10, 11, 12, 13, 14, 18 |
| 2 | 1, 2, 3, 4 | 1, 4 |
| 3 | 1, 3, 4, 5 | 1, 3, 4, 5, 6, 9, 10, 11, 12 |
Area of Study 1 sample application task: Data analysis – The Stock Exchange
Area of Study 1 sample application task: Data analysis – The Stock Exchange
The application task is to be of 4–6 hours' duration over a period of one to two weeks.
Introduction
Various stock exchanges from around the world are well known and provide important data that informs economic analysis. Various global events impact on the value of stock market indexes. In this task, the behaviour of the stock exchange in Australia, the US and Hong Kong and their association is investigated.
A measure of the Australian Stock Exchange is the ASX100. See data for the last calendar month.
A measure of the US Stock Exchange is the Dow Jones Index. See data for the last calendar month.
A measure of the Hong Kong Stock Exchange is the Hang Sen Index. See data for the last calendar month.
Component 1
- Construct a time series plot of the ASX100 over the last calendar month and describe any fluctuations.
- Using an appropirate smoothing method, smooth the data and describe the smoothed plot.
Component 2
- Investigate the relationship between the ASX100 and the Dow Jones for a calendar month.
- Construct a scatterplot of the ASX100 against the Dow Jones, and describe it in terms of direction, form and strength.
- Determine the correlation and coefficient of determination, and interpret these measures.
- Determine the equation of the regression line, draw the regression line on the scatterplot, and interpret the intercept and slope in terms of the ASX and the Dow Jones.
- Use your model to predict the ASX100 from the Dow Jones for the first trading day of the following month. Comment on your prediction.
- Investigate the relationship between the ASX100 and the Hang Sen for a calendar month.
- Draw a scatterplot of the ASX100 against the Hang Sen, and describe it in terms of direction, form and strength.
- Determine the correlation and coefficient of determination, and interpret these measures.
- Determine the equation of the regression line, draw the regression line on the scatterplot, and interpret the intercept and slope in terms of the ASX and the Hang Sen.
- Use your model to predict the ASX100 from the Hang Sen for the first trading day of the following month. Comment on your prediction.
- Which of these measures, the Dow or the Hang Sen, would you expect to be on average a better predictor of the ASX100? Give reasons for your choice.
Component 3
Would the model be improved if it was adjusted to reflect the time difference between Australia and the US?
- Make an appropriate adjustment to the ASX100 data to reflect this time difference.
- Construct a scatterplot of the adjusted ASX100 against the Dow Jones, and describe it in terms of direction, form and strength.
- Determine the correlation and coefficient of determination, and interpret these measures.
- Has adjusting the data improved the model?
Areas of study
The following content from the areas of study is addressed through this task.
| Area of study | Topics | Content dot point |
Data analysis, probability and statistics
| Investigating associations between two variables Investigating and modelling linear associations Investigating and modelling time series data
| 4, 5, 6
1, 2, 3, 4, 5, 6, 7, 8
1, 2, 3 |
Outcomes
The following outcomes, key knowledge and key skills are addressed through this task.
| Outcome | Key knowledge dot point | Key skill dot point |
| 1 | 1, 2, 4, 7, 8, 9, 10, 11, 13 | 2, 3, 7, 8, 9, 10, 11, 12, 13, 14, 18 |
| 2 | 1, 2, 3, 4 | 1, 4 |
| 3 | 1, 3, 4, 5, 6 | 1, 3, 4, 5, 6, 7, 9, 10, 11, 12 |
Area of Study 2 sample modelling or problem-solving task: Investments
Area of Study 2 sample modelling or problem-solving task: Investments
The modelling or problem-solving task is to be of 2–3 hours' duration over a period of one week.
Introduction
Investing assets to increase wealth is always a challenging experience. It takes constant monitoring to ensure the chosen investments are performing as expected and redeployment of some assets across different sectors is expected at various times. This task explores some investment option strategies and investigates their development over defined time periods. It also looks at comparisons between different investment options.
Data from the various sources listed can be used to help with the investment choices.
Property – residential
Property – international
Shares – domestic
Shares – international
Loan rates – Savings, Moneysmart
Part 1
Three possible investment options will be constructed using a fixed principal of $100,000 and selected time period of four years.
- Purchase an international property that will be rented out for the entire investment period of four years. Consider the investment home loan that would be needed and repayments that would be required (including the rental money). Include calculations and a visual image showing the loan balance for each of the first 12 months. At the end of the investment period, sell the property, incorporating the property value increase, and investigate the growth of the investment.
- Purchase a domestic property that will be rented out for the entire investment period of four years. Consider the investment home loan that would be needed and repayments that would be required (including the rental money). Include calculations and a visual image showing the loan balance for each of the first 12 months. At the end of the investment period, sell the property, incorporating the property value increase, and investigate the growth of the investment.
- Purchase a portfolio of five shares (domestic or international or a combination). Consider the loan that would be needed and repayments that would be required. Include calculations and a visual image showing the share portfolio balance for each of the first 12 months. A representative value for the share price across the month can be used. At the end of the investment period, sell the shares, pay out the loan and investigate the growth of the investment.
- Summarise the outcome of each investment and indicate which option is the most appealing reasons for this preference.
Part 2
Explore some investment goals using the scenarios that were developed in Part 1.
- Calculate the time period that would result in an increase of 50% in the original investment if the domestic property purchase was used in equal proportion with the shares portfolio. Include any assumptions or constraints that would be needed for this scenario.
- Calculate the time period that would result in an increase of 50% in the original investment if the international property was the sole investment. Include any assumptions or constraints that would be needed for this scenario.
- Consider one other strategy that would result in an increase of 50% in the original investment. Include any assumptions or constraints that would be needed for this scenario.
- Summarise the outcome of each investment and indicate which option is the most appealing and reasons for this preference.
Areas of study
The following content from the areas of study is addressed through this task.
| Area of study | Topics | Content dot points |
Discrete mathematics
| Compound interest investments and loans Reducing balance loans | 1, 2, 4
1, 2, 3 |
Outcomes
The following outcomes, key knowledge and key skills are addressed through this task.
| Outcome | Key knowledge dot point | Key skill dot point |
| 1 | 1, 2, 3, 4 | 1, 2, 3, 4, 5 |
| 2 | 1, 2, 3, 4 | 2, 4 |
| 3 | 1, 2, 3, 4, 5, 7 | 1, 3, 4, 5, 6, 9, 10, 11, 12 |
Area of Study 2 sample modelling or problem-solving task: Recursion and financial modelling (superannuation)
Area of Study 2 sample modelling or problem-solving task: Recursion and financial modelling (superannuation)
The modelling or problem-solving task is to be of 2–3 hours' duration over a period of one week.
Introduction
A context such as the following could be used to develop a task which involves using real data as a basis for modelling superannuation final payout figures under various parameters, where students have some input into the selection of parameter values to develop scenarios.
In preparation for this task, data should be gathered on trend estimates for full time adult average weekly ordinary time earnings for people wishing to retire at age 67 see ABS.
Data should also be collected on estimated superannuation pay out figures for full-time workers at a range of ages. See Moneysmart.
Part 1
Assume Casey is an adult born on 1 July 1992, currently working full time on average adult weekly earnings and wishing to retire at age 67. Casey has a nil superannuation balance, will not make any additional superannuation contributions, and has the compulsory employer superannuation contributions invested in a fund with medium fees and a 'balanced' investment profile.
- Use the data collected to determine Casey's weekly earnings at age 67 if earnings remain consistent with the average adult weekly earnings, and trend estimates for weekly earnings and growth in weekly earnings remain consistent over the time of her working life. Use a relation or formula to define a suitable final weekly earnings function for a combination of age, current earnings and estimated rate of earnings growth. Graphically represent the growth in Casey's weekly earnings over her working life (start date next birthday on 01 July 2017 and end date 67th birthday on 01 July 2059).
- Use the data collected to determine the estimated superannuation balance at retirement age for Casey. Use a suitable relation or formula to define a suitable superannuation end balance function for a combination of age, salary and employer contributions. Graphically represent the growth of the superannuation balance over the working life of Casey, taking into account all considerations pertaining to superannuation in the profile of Casey above.
- Graphically compare the growth of the superannuation end balance if Casey decides to make set additional contributions of an amount determined by you over the term of Casey's working life (for example, $200.00 per month). Reflect this change in Casey's additional contributions in the recurrence relation in b. above.
- Calculate the difference in end superannuation balances for Casey from b. and c. above.
Part 2
Compulsory employer superannuation (SG) contribution rates are typically fixed for a certain period and may vary over time. Assume that the employer contribution rate will increase to 12% from 01 July 2017 onwards.
- Determine the new end superannuation balance for Casey based on these changes to the employer's superannuation contributions based on the superannuation profile for Casey in Part 1.
- Graphically represent the altered growth of Casey's superannuation balance using the start date and end date details from Part 1, a.
- Calculate the differences in end superannuation balances for Casey from Part 1b. and Part 1c.
Part 3
Consider and explore the changes to Casey's superannuation end balance if different investment strategies were adopted for the duration of Casey's working life (see, for example: Superguide and Australian Super.
Areas of study
The following content from the areas of study is addressed through this task.
| Area of study | Topic | Content dot points |
Discrete mathematics
| Compound interest investments and loans | 1, 2, 3, 4 |
Outcomes
The following outcomes, key knowledge and key skills are addressed through this task.
| Outcome | Key knowledge dot point | Key skill dot point |
| 1 | 1, 2, 3, 4 | 1, 2, 3, 4, 5 |
| 2 | 1, 2, 3, 4 | 2, 4 |
| 3 | 1, 2, 3, 4, 5, 7 | 1, 3, 4, 5, 6, 9, 10, 11, 12 |
Area of Study 2 sample modelling or problem-solving task: Recursion and financial modelling (house loan)
Area of Study 2 sample modelling or problem-solving task: Recursion and financial modelling (house loan)
The modelling or problem-solving task is to be of 2–3 hours' duration over a period of one week.
Introduction
A context such as the following could be used to develop a task which involves using real data as a basis for modelling a house loan and repayments under various parameters, where students have some input into the selection of parameter values.
As preparation for this task, data should be gathered on the average income for people in the 25–30 year age bracket see, for example: Australian Bureau of Statistics current home loan rates and a range of house prices that that would be affordable for example in the range \$500,000 to \$900,000.
Part 1
Assume two people are buying a house together and both are in the age range indicated above.
- Use the data gathered to select a house, a combined income and a fixed interest rate that is initially assumed to apply for the duration of the loan. Use a recurrence relation to define a suitable repayment function for a loan. Draw a graph of the amount owing over the duration of the loan, and also a graph of the amount of repayment for principal and interest over the duration of the loan. Calculate the total cost of the loan and the total interest payable.
- Repeat part a. for some other combinations of interest rates and loan periods. Compare and comment on these graphs and the original graph.
Part 2
Interest rates are typically fixed for a certain initial period of a loan and then vary over time. People's income will also vary over time, as will their capacity to make repayments due to change in circumstances. From time to time, people may also receive a benefit, for example as a bonus, gift or windfall.
- Select a scenario from Part 1 and explore the effect of one or more special payments of principal following receipt of a benefit.
- Select a scenario from Part 1 and explore the effect of several changes of interest rate during the period of the loan.
In each case plot a graph of the amount owing and the amount of payment to principal and interest, and calculate the total cost of the loan and the total interest payable.
Areas of study
The following content from the areas of study is addressed through this task.
| Area of study | Topic | Content dot points |
| Discrete mathematics | Reducing balance loans | 1, 2, 3 |
Outcomes
The following outcomes, key knowledge and key skills are addressed through this task.
| Outcome | Key knowledge dot point | Key skill dot point |
| 1 | 1, 2, 3, 4 | 1, 2, 3, 4, 5 |
| 2 | 1, 2, 3, 4 | 2, 4 |
| 3 | 1, 2, 3, 4, 5, 7 | 1, 3, 4, 5, 6, 9, 10, 11, 12 |
Unit 4 sample assessment tasks
Area of study 2 Matrices sample modelling or problem-solving task: An election campaign
Area of study 2 Matrices sample modelling or problem-solving task: An election campaign
The modelling or problem-solving task is to be of 2–3 hours' duration over a period of 1 week.
Introduction
An election has been called and several candidates are planning their campaigns for the following weeks until the day of the election. Contextual information and related data for the scenario in each of the parts of the task below can be obtained from various print and/or digital media and web sources such as: Google maps, AEC or ABC.
Part 1
A candidate proposes to visit several venues/localities in their electorate on a campaign tour. Use an adjacency matrix based on map information for a given electorate to construct a diagram of the roads connecting these proposed venues/localities.
- Find a possible tour so that the candidate can visit each of the given venues/localities.
- Due to ongoing roadworks, some diversions are put in place for several roads between venues/localities and others are temporarily made one-way only. Modify the adjacency matrix to incorporate this new information and find a revised tour.
Part 2
There are several candidates for the electorate, and the election campaign may run over a period of one to two months. A survey of voters finds that preferences for the candidates change from week to week leading up to the election according to a given transition diagram. The number of voters enrolled for the electorate is assumed to remain constant until the election is held. An initial state matrix indicates voter preferences for the candidates just prior to the start of the election campaign.
- Construct the corresponding transition matrix, find the state matrices for the first several weeks of the campaign, and describe the trend in voter preferences over these weeks.
- The election is held after a specified number of weeks: calculate the number of votes each candidate would be expected to receive on the day of the election. If the campaign turns out to be an extended one, calculate the number of votes each candidate would be expected to receive on the day of the election.
- From time to time during an election campaign, a particular event may have a significant effect on voter preferences, for example a candidate may withdraw, or be replaced by a different candidate. Assume that an event of this kind occurs during the third week of an extended campaign, and the transition matrix is changed accordingly. Describe the effect of this on the trend in voter preferences and the number of votes the candidates would be expected to receive on the day of the election.
Part 3
The candidates participate in a series of two-person debates, where each candidate debates with one of the others. Every candidate debated against all other candidates once and a winner is determined for each debate. The results are recorded and a summary provided at the conclusion of the round of debates.
- Construct a diagram which represents these results and use one-step and two-step dominance matrices to determine the overall winner of the debates.
- Given a table of one-step and two-step dominances, determine the outcome the debates.
Areas of study
The following content from the areas of study is addressed through this task.
| Area of study | Topics | Content dot points |
Discrete mathematics
| Matrices and their applications
Transition matrices | 1, 2, 3, 4, 5
1, 3 |
Outcomes
The following outcomes, key knowledge and key skills are addressed through this task.
| Outcome | Key knowledge dot point | Key skill dot point |
| 1 | 1, 2, 3, 4 | 1, 2, 3 |
| 2 | 1, 2, 3, 4 | 2, 3, 4 |
| 3 | 1, 2, 4, 5, 7 | 1, 2, 3, 4, 9, 10, 11, 12 |
Area of Study 2 matrices sample modelling or problem-solving task: Trophic cascades
Area of Study 2 matrices sample modelling or problem-solving task: Trophic cascades
The modelling or problem-solving task is to be of 2–3 hours' duration over a period of one week.
Introduction
Trophic cascades occur when predators in a food web alter the abundance of their prey to such an extent that they protect the next trophic level down from predation or herbivory.
Contextual information and relevant examples to investigate for the scenario in each of the parts of the task below can be obtained from various web sources, such as the wolves in Yellowstone Park.
Part 1
Using a chosen trophic cascade scenario (for example, sea otter), construct a network structure where a combination of around ten carnivores and herbivores are chosen and investigated to find the dominant carnivore or herbivore using a one-step, and then a one and two-step, dominance matrix.
- Construct the corresponding one-step dominance matrix for your chosen combination and provide a rank order of all listed carnivores and herbivores.
- Calculate a two-step dominance matrix. Choose three non-zero elements from this matrix and list the particular predator-prey sequence linked to the choices made. Complete the one and two-step dominance ranking to determine if one particular herbivore or carnivore is dominant over all others.
Part 2
Create a transition matrix by using a series of numeric values to represent percentage changes in population values of chosen species due to birth and death rates and immigration and emigration rates.
Couple this with an initial state matrix of populations of species and investigate changes in population over a period of time. Defined populations could be used to trigger the promotion of the next trophic level down from predation or herbivory. Times needed to reach the 'trigger' point could be investigated.
- Construct a transition matrix for several species (for example, killer whale, sea otter and sea urchin) in a trophic cascade, then find the state matrices for the first few years and describe any trends. For example:

- Investigate and comment on the populations reaching the same levels. What would happen in the long term if this transition scenario was to continue?
- Introduce a critical population level for a species (for example, sea urchin) that will trigger the promotion of the next trophic level down from predation or herbivory. Use the transition and initial state matrices to investigate when this will occur.
Part 3
To sustain a longer cycle for the promotion of the next trophic level down, additional species are introduced into the trophic cascade. Each year 'farmed' species are transported to the site and introduced.
- Create a matrix to represent additional numbers of species into the system and investigate the effect this has on the sustainability of the system.
- If the initial time period to reach the critical trigger point was to double and the transition and initial state matrices kept their initial values, investigate the number of species that would need to be 'farmed' and introduced each year.
Areas of study
The following content from the areas of study is addressed through this task.
| Area of study | Topics | Content dot points |
Discrete mathematics
| Matrices and their applications
Transition matrices | 1, 3, 5
1, 2, 3, 4 |
Outcomes
The following outcomes, key knowledge and key skills are addressed through this task.
| Outcome | Key knowledge dot point | Key skill dot point |
| 1 | 1, 3, 4 | 1, 2, 3, 4 |
| 2 | 1, 2, 3, 4 | 2, 3, 4 |
| 3 | 1, 2, 4, 5, 7 | 1, 2, 3, 4, 9, 10, 11, 12 |
Area of Study 2 Networks and decision mathematics module sample modelling or problem-solving task: Planning a campaign
Area of Study 2 Networks and decision mathematics module sample modelling or problem-solving task: Planning a campaign
The modelling or problem-solving task is to be of 2–3 hours' duration over a period of 1 week.
Introduction
An election has been called and several candidates are planning their campaign. Students could work with real data from the AEC or VEC electorate within which they live.
Particular elements for networks to be analysed can be chosen according to a common set of specifications, for example the range and number of localities, venues/events to be visited and tasks to be undertaken.
Part 1
Candidates plan to tour towns/suburbs in their electorate using a network.
- For a candidate to visit all the towns/suburbs in their electorate, determine the type of travel situation encountered – walk, trail, path circuit or cycle.
- A candidate operates from an office as a campaign base, requiring a circuit or a cycle for their tour. Determine whether this is possible for their electorate, and the shortest distance to be travelled to visit the towns/suburbs.
- A candidate has volunteer helpers living in each town/suburb. Find the shortest network linking all of these helpers.
- From time to time issues arise which require a candidate to make a special visit to a location, venue or event from where their office is based. Consider several such visits and find the shortest trip for the candidate to travel from their base to the location.
Part 2
The management of the campaign requires the completion of a number of tasks and the campaign manager has set up a directed network that outlines required activities. Related to the given context, consider a suitable scenario for this.
- Find the EST and/or LST for activities in this network.
- Find the activities, in order, on the critical path length for this network, and determine the total time required to complete all tasks.
- Changes in circumstance may require a particular step not on the critical path to be completed before another step; and additional resources may become available. Analyse how these variations affect the overall completion of tasks.
Part 3
Volunteers assist in a range of ways and need to be able to do several jobs to get things done. For example, at a given stage in the campaign, there may be four volunteers helping a candidate and four key tasks to be completed. Related to the given context, consider a suitable scenario for this.
- Initially, the volunteers are limited in what they can do, based on their existing experience and expertise. Draw up a bipartite graph to show how the tasks are completed by the volunteers.
- As the campaign progresses, the volunteers develop their experience and expertise further, and each are able to perform all key tasks, but with different levels of proficiency. Determine the most effective allocation of volunteers to tasks.
- Consider the effect of change in the range of tasks required, and/or the capacity of volunteers to carry out these tasks, on their effective allocation.
Areas of study
The following content from the areas of study is addressed through this task.
| Area of study | Topics | Content dot points |
Discrete mathematics
| Graphs and networks
Exploring and travelling problems
Trees and minimum connector problems
Shortest path problems
Matching problems
The scheduling problem and critical path analysis | 1, 2
1, 2, 3
1, 2, 3
1, 2
1, 2
1, 3 |
Outcomes
The following outcomes, key knowledge and key skills are addressed through this task.
| Outcome | Key knowledge dot point | Key skill dot point |
| 1 | 1, 2, 3, 5, 6, 7 | 1, 2, 3, 5, 6, 7 |
| 2 | 1, 2, 3, 4 | 3, 4 |
| 3 | 1, 2, 3, 4, 5, 7 | 1, 3, 4, 5, 9, 10, 11, 12 |
Area of Study 2 Networks and decision mathematics sample modelling or problem-solving task: Building and managing a distribution centre warehouse
Area of Study 2 Networks and decision mathematics sample modelling or problem-solving task: Building and managing a distribution centre warehouse
The modelling or problem-solving task is to be of 2–3 hours' duration over a period of one week.
Introduction
Large retail groups have distribution centre warehouses built to service several stores in a region. Consider the scenario where a new warehouse is to be built, and then service a network of stores. By using the internet and searching for well-known major retail groups, real data of warehouse locations and store locations can be obtained in relation to a city and its suburbs, for example, Melbourne.
Network construction and aspects of networks for analysis can be chosen according to a common set of specifications, for example the range and number of localities, venues/events to be visited and tasks to be undertaken.
Part 1
Consider a list of activities that will need to be undertaken for a distribution centre warehouse to be built. A sample list could be used as a guide.
- Represent the list of activities as a network, and carry out critical path analysis to determine the minimum time for the warehouse to be constructed.
- Consider a crashing situation where several (for example, three) of the activity completion times are reduced for a cost, and analyse these variations to determine if the previous critical path is changed and/or reduced in time.
- Due to planning requirements, an additional activity is to be incorporated, such as installing under slab plumbing (for example, 12 days), or installing pre-wiring (for example, 8 days). Analyse the effect of including this activity.
Part 2
A set of stores makes up a distribution network. Include distances to allow calculations to be made. Various travel options will be explored as well as minimum time analysis.
- Select five to 10 stores positioned at various distances from the distribution centre warehouse, to make up a network and include various routes (with multiple paths between some stores) and travel distances to each store.
- A particular delivery is needed to ensure all stores receive supplies of a particular product by lunchtime. Map out an efficient delivery run, taking into account the number of trucks used, time, distance and cost. State any assumptions and constraints.
- A new store is added to the network. Analyse the impact of this on the delivery run developed in b. above.
Part 3
As business expands, more distribution centres are built in outer suburbs of the city. These can be used, along with the original centre, to service all available stores. Trucks from different distribution centres can service various stores, with some of the stores being common to the different distribution centres.
- Initially, consider, for example, four distribution centres and four stores. Analyse the optimal allocation of services for this scenario.
- Consider the effect on your analysis in part a. if you add to the initial four stores a small number of additional stores, and then also an additional distribution centre.
Areas of study
The following content from the areas of study is addressed through this task.
| Area of study | Topics | Content dot points |
Discrete mathematics
| Graphs and networks
Exploring and travelling problems
Trees and minimum connector problems
Shortest path problems
Matching problems
The scheduling problem and critical path analysis | 2
1, 2, 3
1, 2, 3
1, 2
2
1, 2, 3, 4 |
Outcomes
The following outcomes, key knowledge and key skills are addressed through this task.
| Outcome | Key knowledge dot point | Key skill dot point |
| 1 | 1, 2, 3, 5, 6, 7 | 1, 2, 3, 5, 6, 7 |
| 2 | 1, 2, 3, 4 | 3, 4 |
| 3 | 1, 2, 3, 4, 5, 7 | 1, 3, 4, 5, 9, 10, 11, 12 |
Authentication
The teacher must consider the authentication strategies relevant for each assessment task. Information regarding VCAA authentication rules can be found in the VCE Administrative Handbook section: Scored assessment: School-based Assessment.
School-assessed Coursework videos
A series of videos and materials to help teachers develop School-assessed Coursework. Read terms and conditions
Performance descriptors
The VCAA performance descriptors are advice only and provide a guide to developing an assessment tool when assessing the outcomes of each area of study. The performance descriptors can be adapted and customised by teachers in consideration of their context and cohort, and to complement existing assessment procedures in line with the VCE Administrative Handbook and the VCE assessment principles.
Performance descriptors can assist teachers in moderating student work, in making consistent assessment, in helping determine student point of readiness (zone of proximal development) and in providing more detailed information for reporting purposes. Using performance descriptors can assist students by providing them with informed, detailed feedback and by showing them what improvement looks like.
The assessment tools (performance criteria, rubrics and / or marking guide) should reflect the outcome, key knowledge and key skills.
Application task performance criteria
Unit 3, Outcome 1
Unit 3 | Mark range | Criterion |
| 0–2 | Appropriate use of mathematical conventions, symbols and terminology Use of correct terminology and conventions in diagrams, tables and graphs, such as axes labels, scales, identification of types of data, representations and summary statistics. Description of key features of data sets including symmetry, skew and outliers. Accurately defining statistical and other mathematical terms or expressions. Use of correct expressions in representations, summaries, computations and symbolic manipulations. | |
| 0–4 | Definition and explanation of key concepts Definition and explanation of statistical and other mathematical concepts and use of appropriate phrases and symbolic expressions. Provision of examples which illustrate key concepts and explain their role in the development of related data analysis. Statement of conditions or restrictions which apply to the definition of a concept. Identification of key concepts in relation to data analysis and explanation of the use of these concepts in applying mathematics in different contexts. | |
| 0–4 | Accurate use of mathematical skills and techniques Use of numerical and symbolic terms to carry out computations, evaluate expressions and formulas, construct tables, produce graphs and solve equations. Use of mathematical routines and procedures for statistical analysis and to solve practical problems involving data analysis. |
Unit 3, Outcome 2
Unit 3 | Mark range | Criterion |
| 0–4 | Identification of important information, variables and constraints Identification of key characteristics of a problem, task or issue and statement of any assumptions underlying the use of relevant statistics and mathematics in the given context. Choice of suitable variables, constants, parameters and statistics for the development of mathematics related to various aspects of data analysis in a given context. Specification of any conditions for use of statistics related to aspects of the given context. | |
| 0–8 | Application of mathematical ideas and content from the specified areas of study Demonstration of understanding of key statistical and mathematical content from one or more areas of study in relation to a given context. Use of specific and general formulations of concepts and content drawn from Data analysis to derive results for analysis in this context. Appropriate use of examples to illustrate the application of a mathematical process, or use of a counter-example to disprove a proposition or conjecture. | |
| 0–8 | Analysis and interpretation of results Analysis and interpretation of results obtained from considering a data set or subsets of the data set. Generation of possible inferences from analysis to draw conclusions related to the context for investigation, and to verify, refute or modify hypotheses. Discussion of the validity and limitations of any models. |
Unit 3, Outcome 3
Unit 3 | Mark range | Criterion |
| 0–4 | Appropriate selection and systematic use of technology Relevant and appropriate selection and systematic use of technology, or a function of the selected technology for the statistical context being considered. Use of appropriate specifications which illustrate key features of the mathematics under consideration. | |
| 0–6 | Application of technology Use and interpretation of the relationship between numerical, graphical and tabular forms of information produced by technology. Analysis of the relationship of the results from an application of technology to the nature of a particular mathematical question, problem or task. Use of tables of values, families of graphs or other results produced using technology to support data analysis in investigative contexts. Production of results efficiently and systematically which identify examples or counter-examples which are clearly relevant to the task. |
A sample record sheet for the Data analysis application task can be used to record student level of achievement with respect to the available marks for the performance criteria relating to each outcome, and to indicate pointers corresponding to relevant aspects of the task.
Modelling or problem-solving task performance criteria
Unit 3
These criteria and mark ranges can be used for the Modelling or problem-solving task for Recursion and financial modelling in Unit 3.
Unit 3, Outcome 1
Unit 3 | Mark range | Criterion |
| 0–1 | Appropriate use of mathematical conventions, symbols and terminology Application of mathematical conventions in diagrams, tables and graphs, such as headings, axes labels and points. Use of symbolic notation appropriately and accurately in defining mathematical terms or expressions, and describing representations of objects such as first order linear recurrence relations for financial modelling. Use of correct expressions in symbolic manipulation or computation in mathematical work. | |
| 0–2 | Definition and explanation of key concepts Definition of mathematical concepts using appropriate phrases and mathematical expressions. Provision of examples which illustrate key concepts and explain their role in the development of related mathematics. Statement of conditions or restrictions which apply to the definition of a concept. Identification of key concepts in relation to each area of study and explanation of the use of these concepts in applying mathematics in different contexts. Construction of mathematical expressions involving concepts such as interest, growth and decay, annuities and perpetuities and first order linear recurrence relations. | |
| 0–2 | Accurate use of mathematical skills and techniques Use of algebraic expressions and numerical values to carry out computations, evaluate expressions and formulas, construct tables, produce graphs and solve equations. Use of mathematical routines and procedures such as generating sequences, and time value of money calculation. | |
Unit 3, Outcome 2
Unit 3 | Mark range | Criterion |
| 0–2 | Identification of important information, variables and constraints Identification of key characteristics of a problem, task or issue and statement of any assumptions underlying the use of relevant financial mathematics in the given context. Choice of suitable variables and constants for the development of mathematics related to various aspects of a given context. Specifications of constraints, such as initial values, domain and range constraints, and variations related to aspects of a context. | |
| 0–4 | Application of mathematical ideas and content from the specified areas of study Demonstration of understanding of key mathematical content from one or more areas of study in relation to a given context. Use of specific and general formulations of concepts and mathematical content drawn from the areas of study to derive results for analysis in this context. Appropriate use of examples to illustrate the application of a mathematical process, or use of a counter-example to disprove a proposition or conjecture. Use of a variety of approaches to develop relations and functions as models for financial computations presented in tabular or graphical form and to set up and solve practical problems. | |
| 0–4 | Analysis and interpretation of results Analysis and interpretation of results obtained from examples or counter-examples to establish or refute general case propositions or conjectures related to a context for investigation. Generation of inferences from analysis to draw conclusions related to the context for investigation, and to verify or modify conjectures or explore variations. Discussion of the validity and limitations of any models. | |
Unit 3, Outcome 3
Unit 3 | Mark range | Criterion |
| 0–2 | Appropriate selection and systematic use of technology Relevant and appropriate selection and systematic use of technology, or a function of the selected technology for the mathematical context being considered, in particular first order linear recurrence relations and time value of money calculations. Distinction between exact and approximate results produced by technology, and interpretation of these results to a required accuracy. Use of appropriate range and domain and other specifications which illustrate key features of the mathematics under consideration. | |
| 0–3 | Application of technology Use and interpretation of the relation between numerical, graphical and symbolic forms of information produced by technology about relations, functions and equations and the corresponding features of those relations, functions or equations. Analysis of the relationship of the results from an application of technology to the nature of a particular mathematical question, problem or task. Use of tables of values, families of graphs, solutions of equations or collections of other results produced using technology to support analysis in problem solving, investigative or modelling contexts. Production of results efficiently and systematically which identify examples or counter-examples which are clearly relevant to the task. | |
A sample record sheet for modelling or problem solving tasks for the selected modules can be used to record student level of achievement with respect to the available marks for the performance criteria relating to each outcome, and to indicate pointers corresponding to relevant aspects of the task.
These performance criteria can be used in several ways:
- directly in conjunction with the sample record sheets and teacher annotations for pointers with respect to key aspects of the task related to each criterion for the outcomes.
- directly with the descriptive text for each criterion modified to incorporate task specific elements as applicable.
- as a template for teachers to develop their own criteria and descriptive text for each criterion, including their own allocation of marks for the criteria with the total mark allocation for each outcome as specified in the study design.
Unit 4
These criteria and mark ranges can be used for the modelling or problem-solving tasks for Matrices and Networks and decision mathematics in Unit 4.
Unit 4, Outcome 1
Unit 4 | Mark range | Criterion |
| Task 1 0–1 | Appropriate use of mathematical conventions, symbols and terminology Application of mathematical conventions in diagrams, tables and graphs, such as axes labels, angles, arcs and points. Use of symbolic notation appropriately and accurately in defining mathematical terms or expressions, and describing representations of objects such as matrices or networks. Use of correct expressions in symbolic manipulation or computation in mathematical work. | |
| Task 2 0–1 | ||
| Task 1 0–2 | Definition and explanation of key concepts Definition of mathematical concepts using appropriate phrases and mathematical expressions. Provision of examples which illustrate key concepts and explain their role in the development of related mathematics. Statement of conditions or restrictions which apply to the definition of a concept. Identification of key concepts in relation to the area of study and explanation of the use of these concepts in applying mathematics in different contexts. Construction of mathematical expressions involving concepts such as matrices and recurrence relations, or directed graphs and networks. | |
| Task 2 0–2 | ||
| Task 1 0–2 | Accurate use of mathematical skills and techniques Use of algebraic expressions and numerical values to carry out computations, evaluate expressions and formulas, construct tables, produce graphs and solve equations. Use of mathematical routines and procedures such as matrix operations, and constructions of networks to obtain results and solve problems. | |
| Task 2 0–2 |
Unit 4, Outcome 2
Unit 4 | Mark range | Criterion |
| Task 1 0–2 | Identification of important information, variables and constraints Identification of key characteristics of a problem, task or issue and statement of any assumptions underlying the use of relevant mathematics in the given context. Choice of suitable variables and constants for the development of mathematics related to various aspects of a given context. Specifications of constraints, such as domain and range constraints, related to aspects of a context. | |
| Task 2 0–2 | ||
| Task 1 0–4 | Application of mathematical ideas and content from the specified areas of study Demonstration of understanding of key mathematical content from one or more areas of study in relation to a given context. Use of specific and general formulations of concepts and mathematical content drawn from the area of study to derive results for analysis in this context. Appropriate use of examples to illustrate the application of a mathematical process, or use of a counter-example to disprove a proposition or conjecture. Use of a variety of approaches to develop matrix recurrence relations as models for data presented in tabular or graphical form. Use of algebra, matrices, networks and graphs to set up and solve problems. | |
| Task 2 0–4 | ||
| Task 1 0–4 | Analysis and interpretation of results Analysis and interpretation of results obtained from examples or counter-examples to establish or refute general case propositions or conjectures related to a context for investigation. Generation of inferences from analysis to draw conclusions related to the context for investigation, and to verify or modify conjectures. Discussion of the validity and limitations of any models. | |
| Task 2 0–4 |
Unit 4, Outcome 3
Unit 4 | Mark range | Criterion |
| Task 1 0–2 | Appropriate selection and systematic use of technology Relevant and appropriate selection and systematic use of technology, or a function of the selected technology for the mathematical context being considered. Distinction between exact and approximate results produced by technology, and interpretation of these results to a required accuracy. Use of appropriate range and domain and other specifications which illustrate key features of the mathematics under consideration. | |
| Task 2 0–2 | ||
| Task 1 0–3 | Application of technology Use and interpretation of the relation between numerical, graphical and symbolic forms of information produced by technology about relations, functions and equations and the corresponding features of those relations, functions or equations. Analysis of the relationship of the results from an application of technology to the nature of a particular mathematical question, problem or task. Use of tables of values, families of graphs, matrices, geometric shapes or objects or collections of other results produced using technology to support analysis in problem solving, investigative or modelling contexts. Production of results efficiently and systematically which identify examples or counter-examples which are clearly relevant to the task. | |
| Task 2 0–3 |
A sample record sheet for modelling or problem solving tasks for the selected modules can be used to record student level of achievement with respect to the available marks for the performance criteria relating to each outcome, and to indicate pointers corresponding to relevant aspects of the task.
These performance criteria can be used in several ways:
- directly in conjunction with the sample record sheets and teacher annotations for pointers with respect to key aspects of the task related to each criterion for the outcomes.
- directly with the descriptive text for each criterion modified to incorporate task specific elements as applicable.
- as a template for teachers to develop their own criteria and descriptive text for each criterion, including their own allocation of marks for the criteria with the total mark allocation for each outcome as specified in the study design.